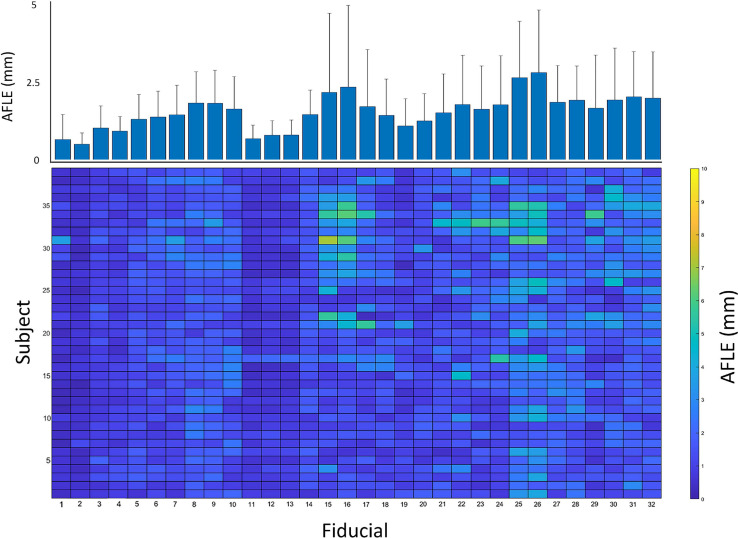
Fig. 2.
Mean anatomical fiducial localization error (AFLE) for each anatomical fiducial (AFID) and subject. Bottom colormap represents mean AFLEs across all raters for each AFID and subject, illustrating the distribution of AFLEs across all subjects and AFIDs. Top bar graph represents the mean AFLEs for each AFID across all 39 subjects + standard deviation. AFIDs 1, 2 had the lowest AFLEs, while AFIDs 25 and 26 had the greatest AFLEs

