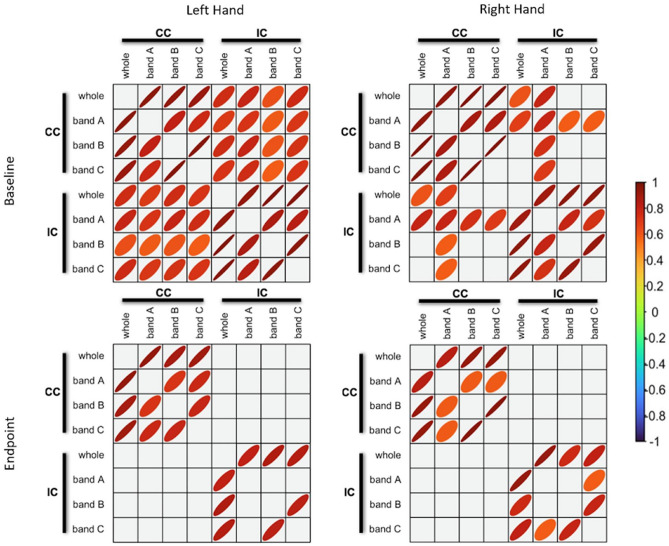
Fig. 3.
LFO Correlational analysis. Significant Bivariate pairwise Pearson correlations for each WM ROI LFO at baseline and after 2-week training (p < 0.05). The thickness of the ellipsoid indicates magnitude of the relationship, such that a thin ellipsoid represents a stronger correlation value (closer to ± 1); whereas a rounder ellipsoid represents weaker correlation. The color of the ellipsoid indicates the sign (positive, negative, no correlation) of the relationship between two variables. A positive relationship is red, negative is blue, and no correlation is green. Whole band: 0.01–0.22 Hz; band A: 0.01–0.08 Hz; band B: 0.08–0.15 Hz; band C: 0.15–0.22 Hz. (CC corpus callosum ROI, IC internal capsule ROI)

