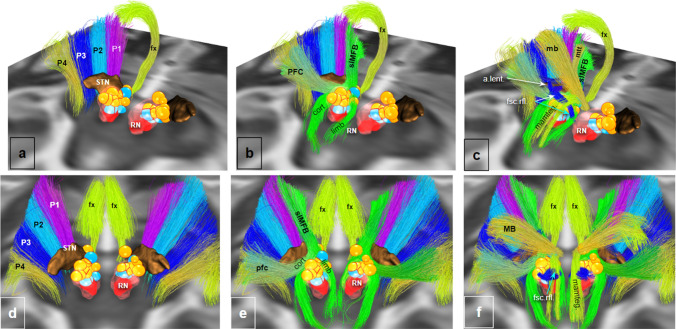
Fig. 11.
Midbrain integrative views of large (P1–P4, slMFB) and small fiber tracts in MNI space (ex-vivo DTI). Concentration of volume of tissue activation spheres of responders (yellow) and non-responders (blue) in the pre-rubral field of the MVT. The Dichotomy between lateral (P1–P4) and medial pathways (slMFB) is clearly demonstrated. a–c, view from posterior and right. d–f, view from superior. Yellow spheres represent simulated activation volumes from responders in FORESEE and FORESEE II trials for treatment-resistant major depression (Deep Brain Stimulation of the superolateral medial forebrain bundle). For response- and simulation-criteria cf. (Coenen et al. 2019b). Note: Responder and non-responder spheres aggregate on slMFB without any significant contact to smaller pathways and STN. P1 fronto-pontine tract; P2 cortico-bulbar tract; P3 cortico-spinal-tract; P4 occipito-temporo-pontine tract; slMFB superolateral branch of the medial forebrain bundle; cort mesocortical fibers, limb, mesolimbic fibers; MVT mesencephalic ventral tegmentum: pfc, prefrontal cortex pathway (motor MFB); mb mammillary body pathway (motor MFB); mtt mammillo-thalamic tract; fx fornix; mamteg mammillo-tegmental tract; a. lent ansa lenticularis; fsc. rfl. fasciculus retroflexus (of Meynert))

