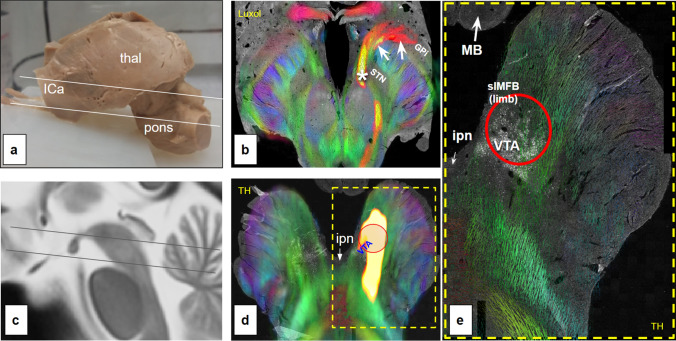
Fig. 8.
Visualization of ex-vivo (n = 1) combined 7T DWI measurement and histological analysis. Tractography of slMFB (yellow) is based on transmitter-information from thyroxine-hydroxylase (TH) staining and the identified VTA cell group. a Ex-vivo specimen; b midbrain section with color-coded directional information (green, anterior–posterior; blue, superior-inferior; red, medial–lateral) superimposed on histological slice (luxol fast blue in black/white). Note nice alignment between DTI and histology information including rendition of “Edinger’s comb” (cerebral peduncle), white arrows indicate ansa lenticularis. c MNI brain midline indicating superior (b) and inferior cuts (c); d, similar as b but more inferior. TH staining shows Dopamine cells of ventral tegmental area (VTA); red circle serves as seed region for slMFB (yellow/red). e Magnification from d. ICa anterior limb of internal capsule; thal thalamus; TH tyrosine hydroxylase; MB mammillary body; ipn interpeduncular nucleus; STN subthalamic nucleus; Gpi globus pallidus internus; *VTA termination field of PFC fibers (approx.)

