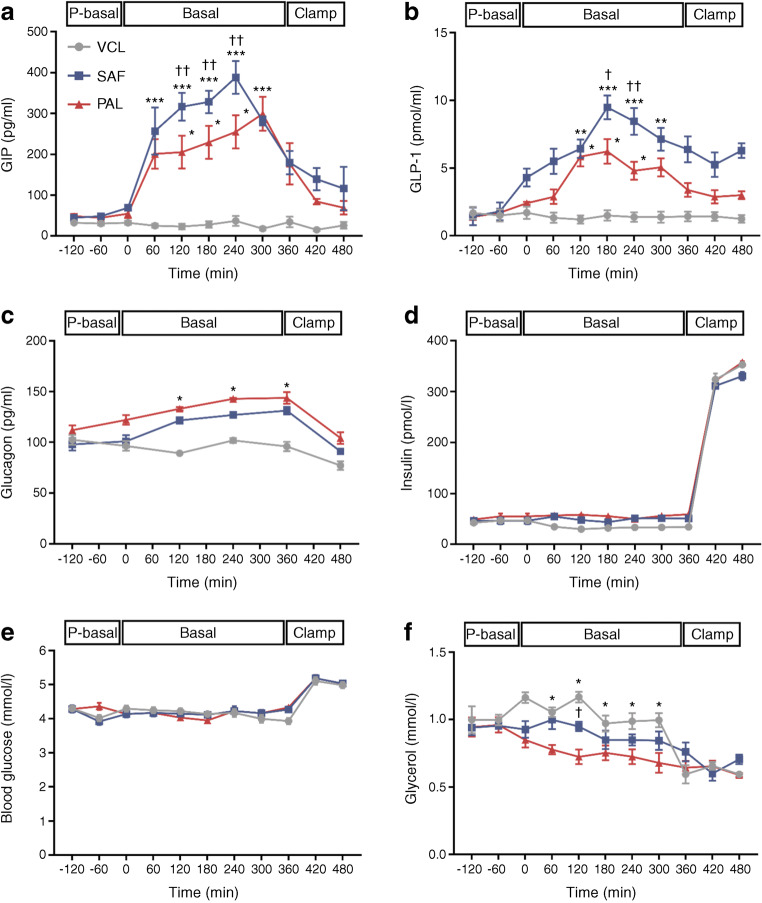
Fig. 3.
Time courses of circulating hormones and metabolites in healthy humans. Concentrations of plasma GIP (a), plasma GLP-1 (b), plasma glucagon (c), plasma insulin (d), blood glucose (e) and plasma glycerol (f) are presented after ingestion of PAL (red), SAF (blue) or VCL (water, grey) at 0 min. Data are shown as means ± SEM; insulin and blood glucose n = 16; GIP, GLP-1, glucagon and glycerol, n = 4. *p < 0.05, **p < 0.01 and ***p < 0.001 vs VCL at same time point; †p < 0.05 and ††p < 0.01 for PAL vs SAF at same time point (ANOVA adjusted for repeated measures with Tukey–Kramer correction for each time point between interventions). P-basal, pre-basal

