
Figure 11.
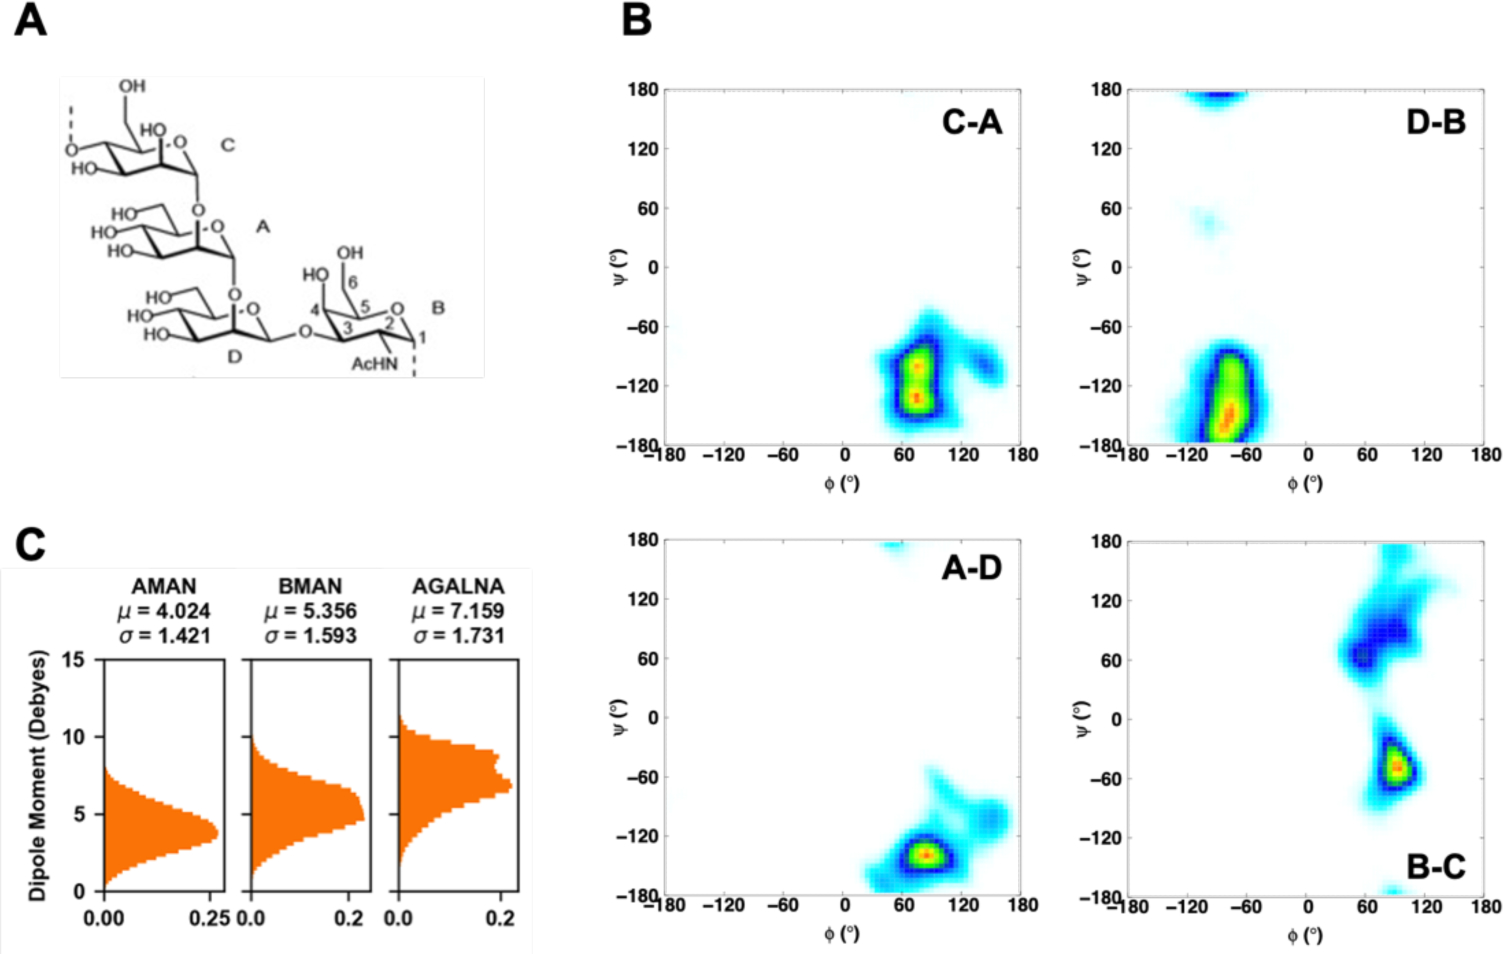
(A) Schematic structure of the repeating units of the O-antigen polysaccharides from E. coli O176. (B) Glycosidic torsion angles ϕ and ψ distributions. ϕ = O5′−C1′−On−Cn, ψ = C1′−On−Cn−C (n−1), where n is the linkage position. The probability range is from white, 0, to blue, 0.1, to green, 0.3, to yellow, 0.7, and to red, 1. (C) Distributions of dipole moments of sugar monomers in the Drude FF.