
Figure 12.
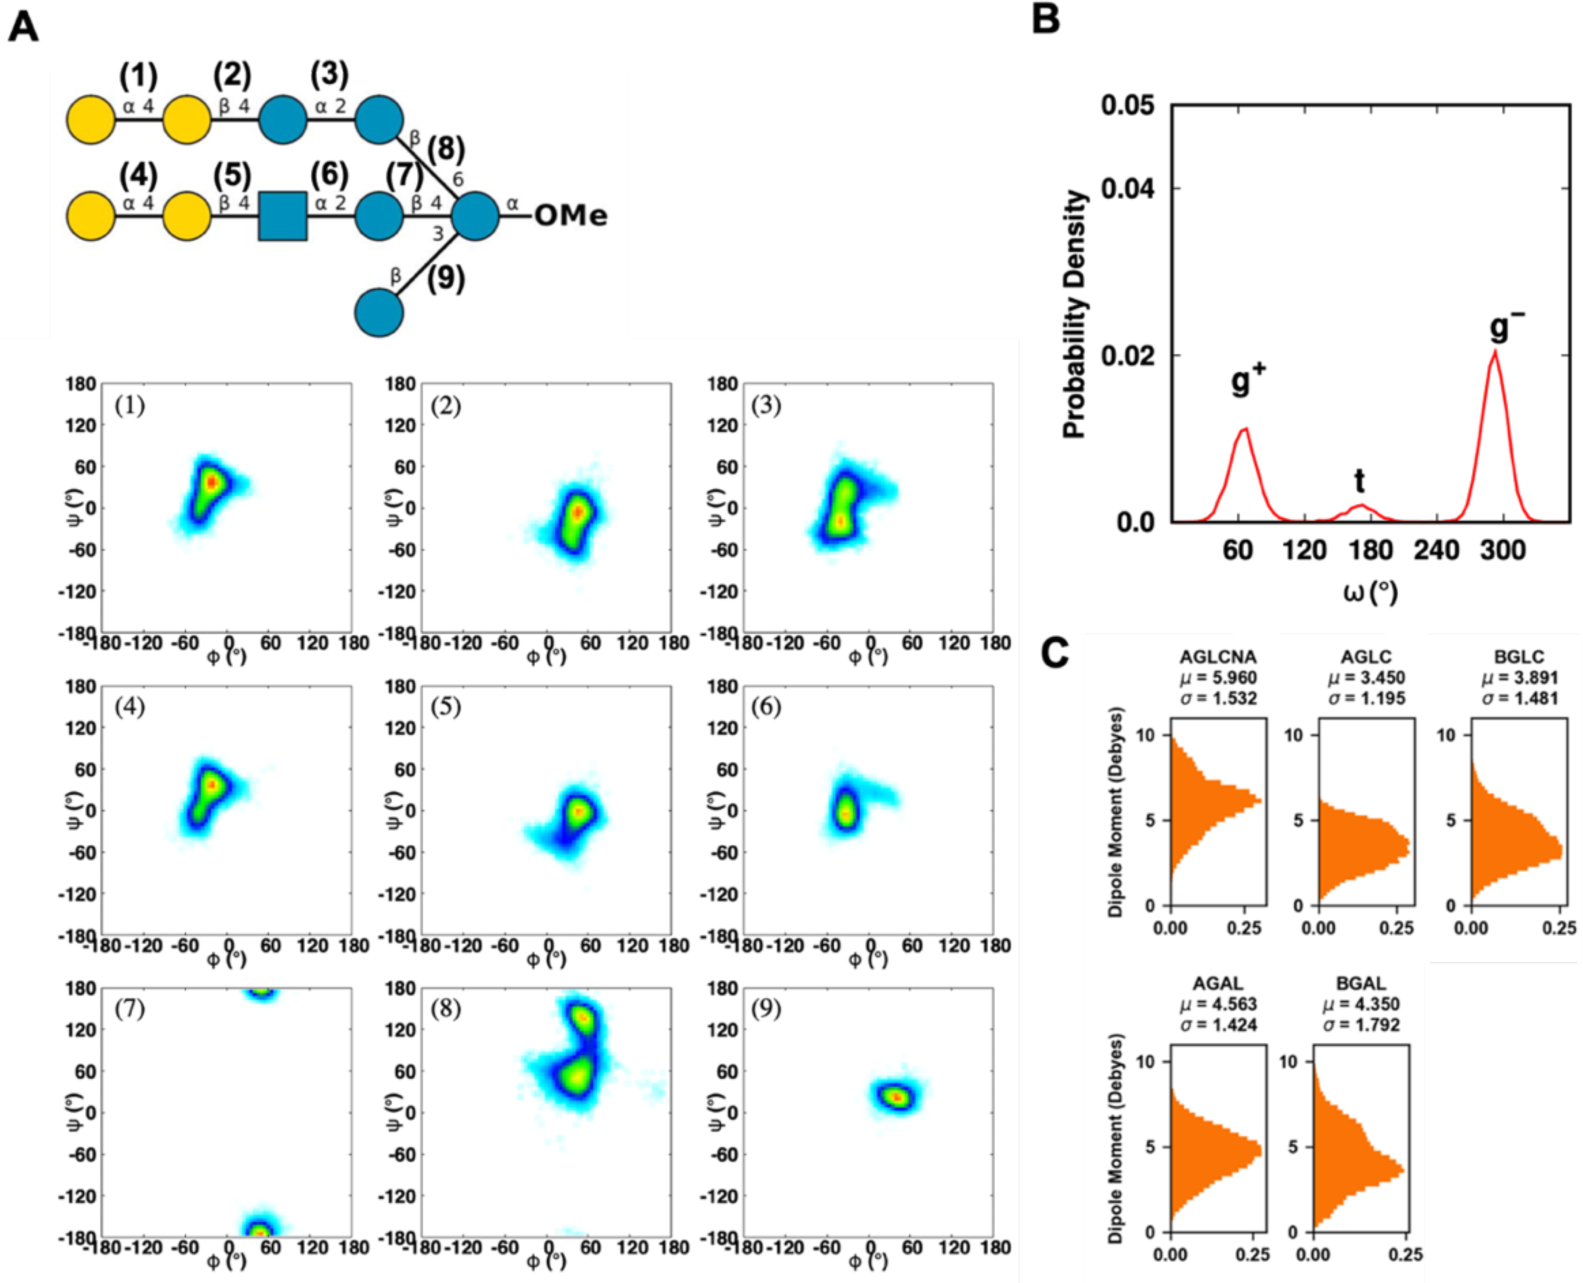
(A) Two-dimensional distributions of ϕ/ψ glycosidic torsion angles of serotype C oligosaccharide of M. catarrhalis. The glycosidic torsion angle definitions are defined in Figure 11. The probability range is from white, 0, to blue, 0.1, to green, 0.3, to yellow, 0.7, and to red, 1. (B) The torsion angle ω is defined as O6-C6-C5-O5, where g+ denotes gauche-trans, g− denotes gauche–gauche, and t denotes trans-gauche. (C) Distributions of dipole moments of sugar monomers.