
Figure 8.
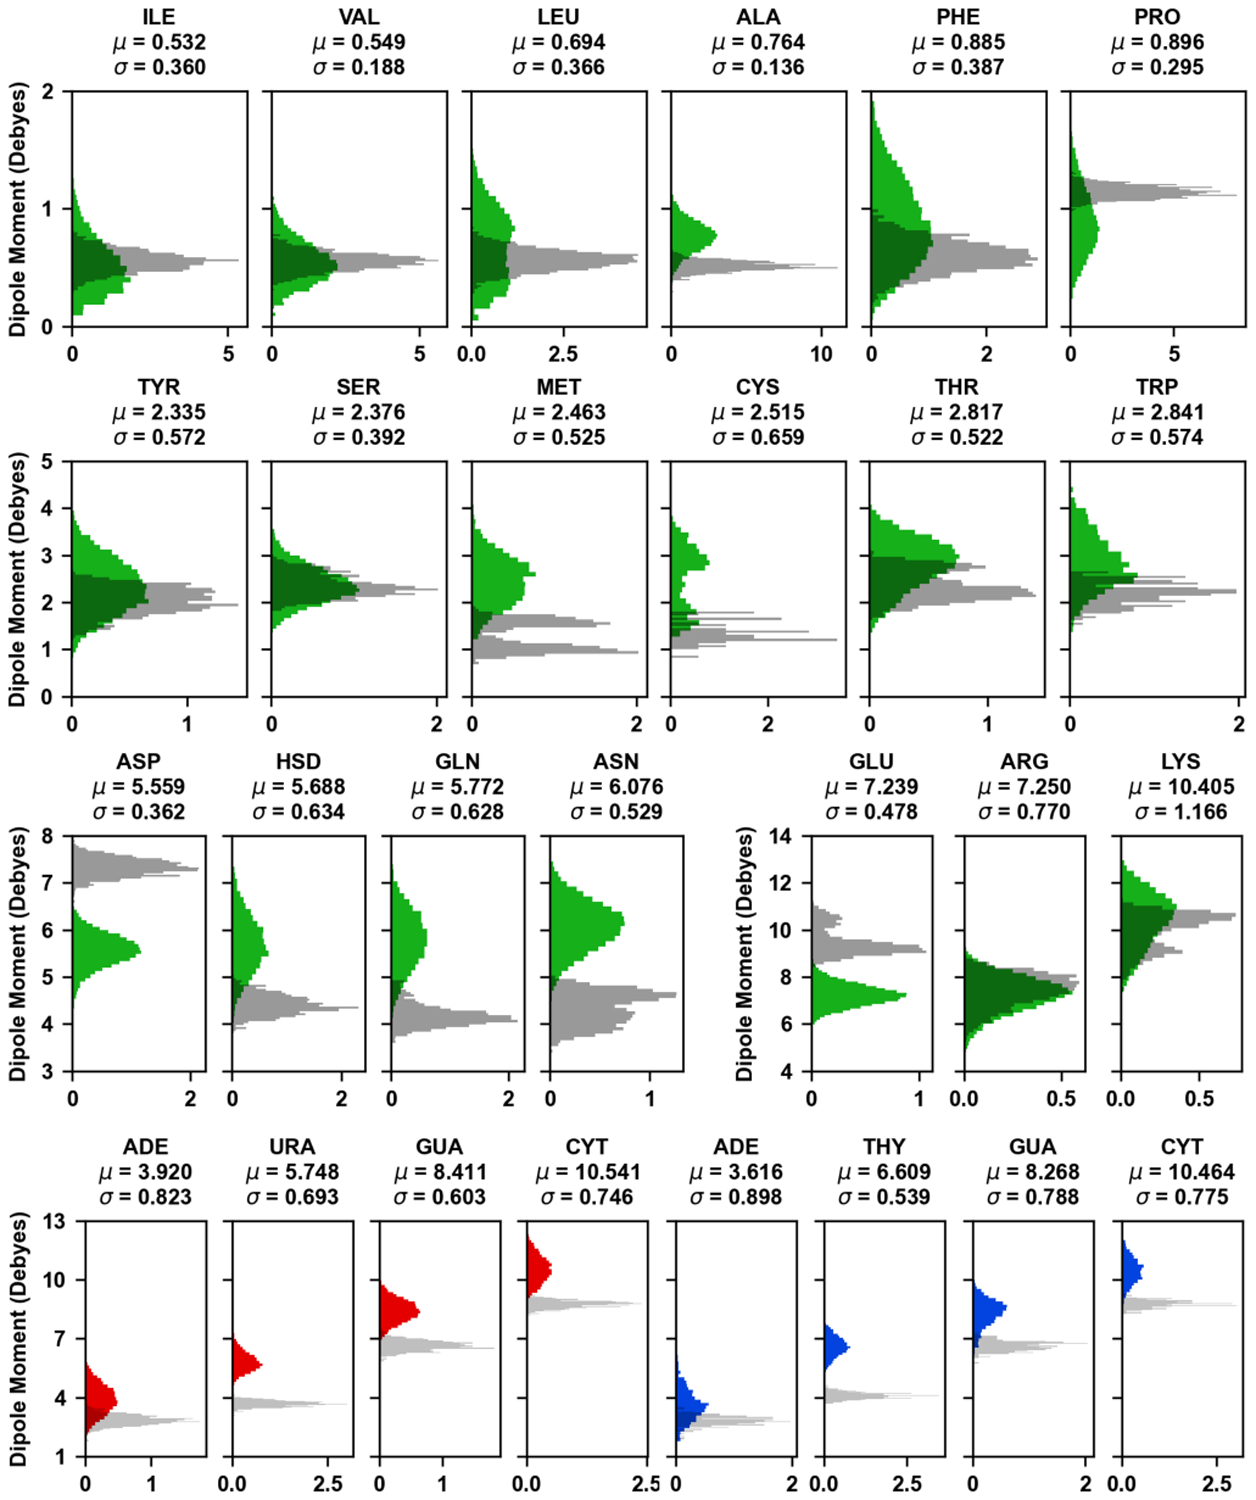
Distributions of dipole moments of amino acid sidechains and nucleobases in the Cas9 complex. The colored histograms correspond to the Drude FF (Cas9 – green; sgRNA – red; DNA – blue) calculated based on 200 ns simulation, while the transparent gray histograms represent the additive FF calculated based on the 1 ns pre-equilibration trajectory. The histograms are normalized and the mean and standard deviation from Drude simulations is shown above each subplot. Comparison of Drude FF dipole moment distributions at 1 ns and 200 ns is presented in Figure S3.