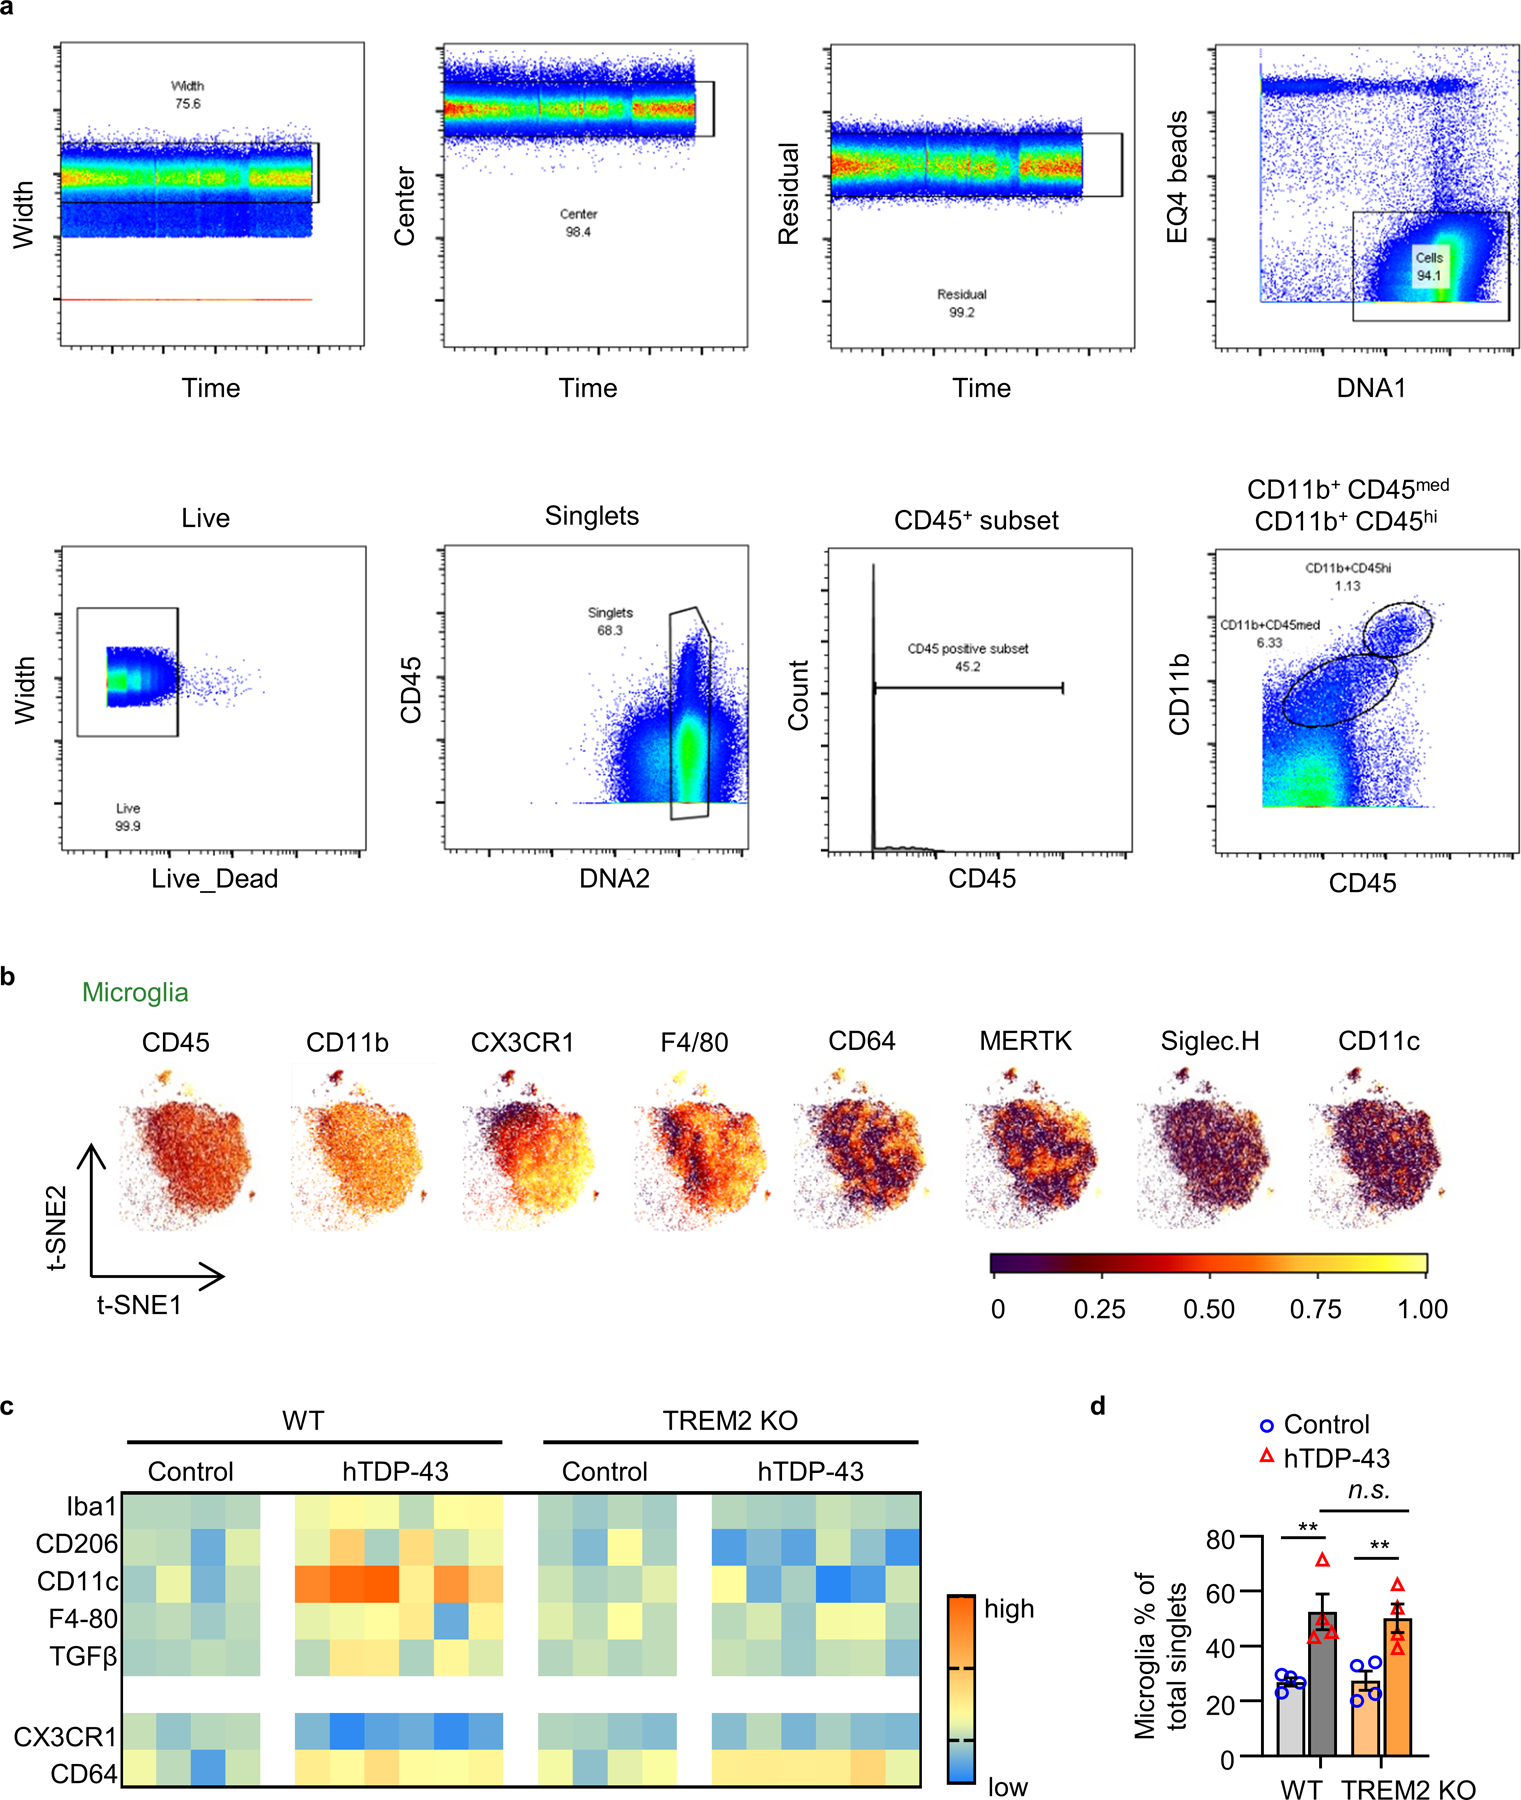
Extended Data Fig. 4. Phenotypic diversity of microglia in response to TDP-43 pathology by CyTOF.

a, A representative gating strategy illustrating brain myeloid cell being subgated to CD45medCD11b+ microglia. b, Microglia were plotted onto a t-SNE. Plots represent distinguishing cell surface markers for microglia of 6 to 8-week-old WT mice. Clustering analysis revealed a major microglia population characterized by CD45mid:CD11b+:CX3CR1hi:F4/80+:CD64+:MERTK+:Siglec-H+:CD11c−. c, Heat map shows the change of expression levels of typical microglial markers in response to TDP-43 pathology in individual samples. Heat colors of expression levels have been scaled for each marker (blue, low expression; orange, high expression). d, Frequency analysis of microglia based on manual gating of indicated groups at 35 dpi. Significance was calculated using two-way ANOVA, Tukey’s post-hoc analysis. Data represented as mean ± SEM. n.s., not significant, *P < 0.05, **P < 0.01, *** P < 0.001. n = 4 per group, P = 0.0008, F 3,9 = 14.79.
