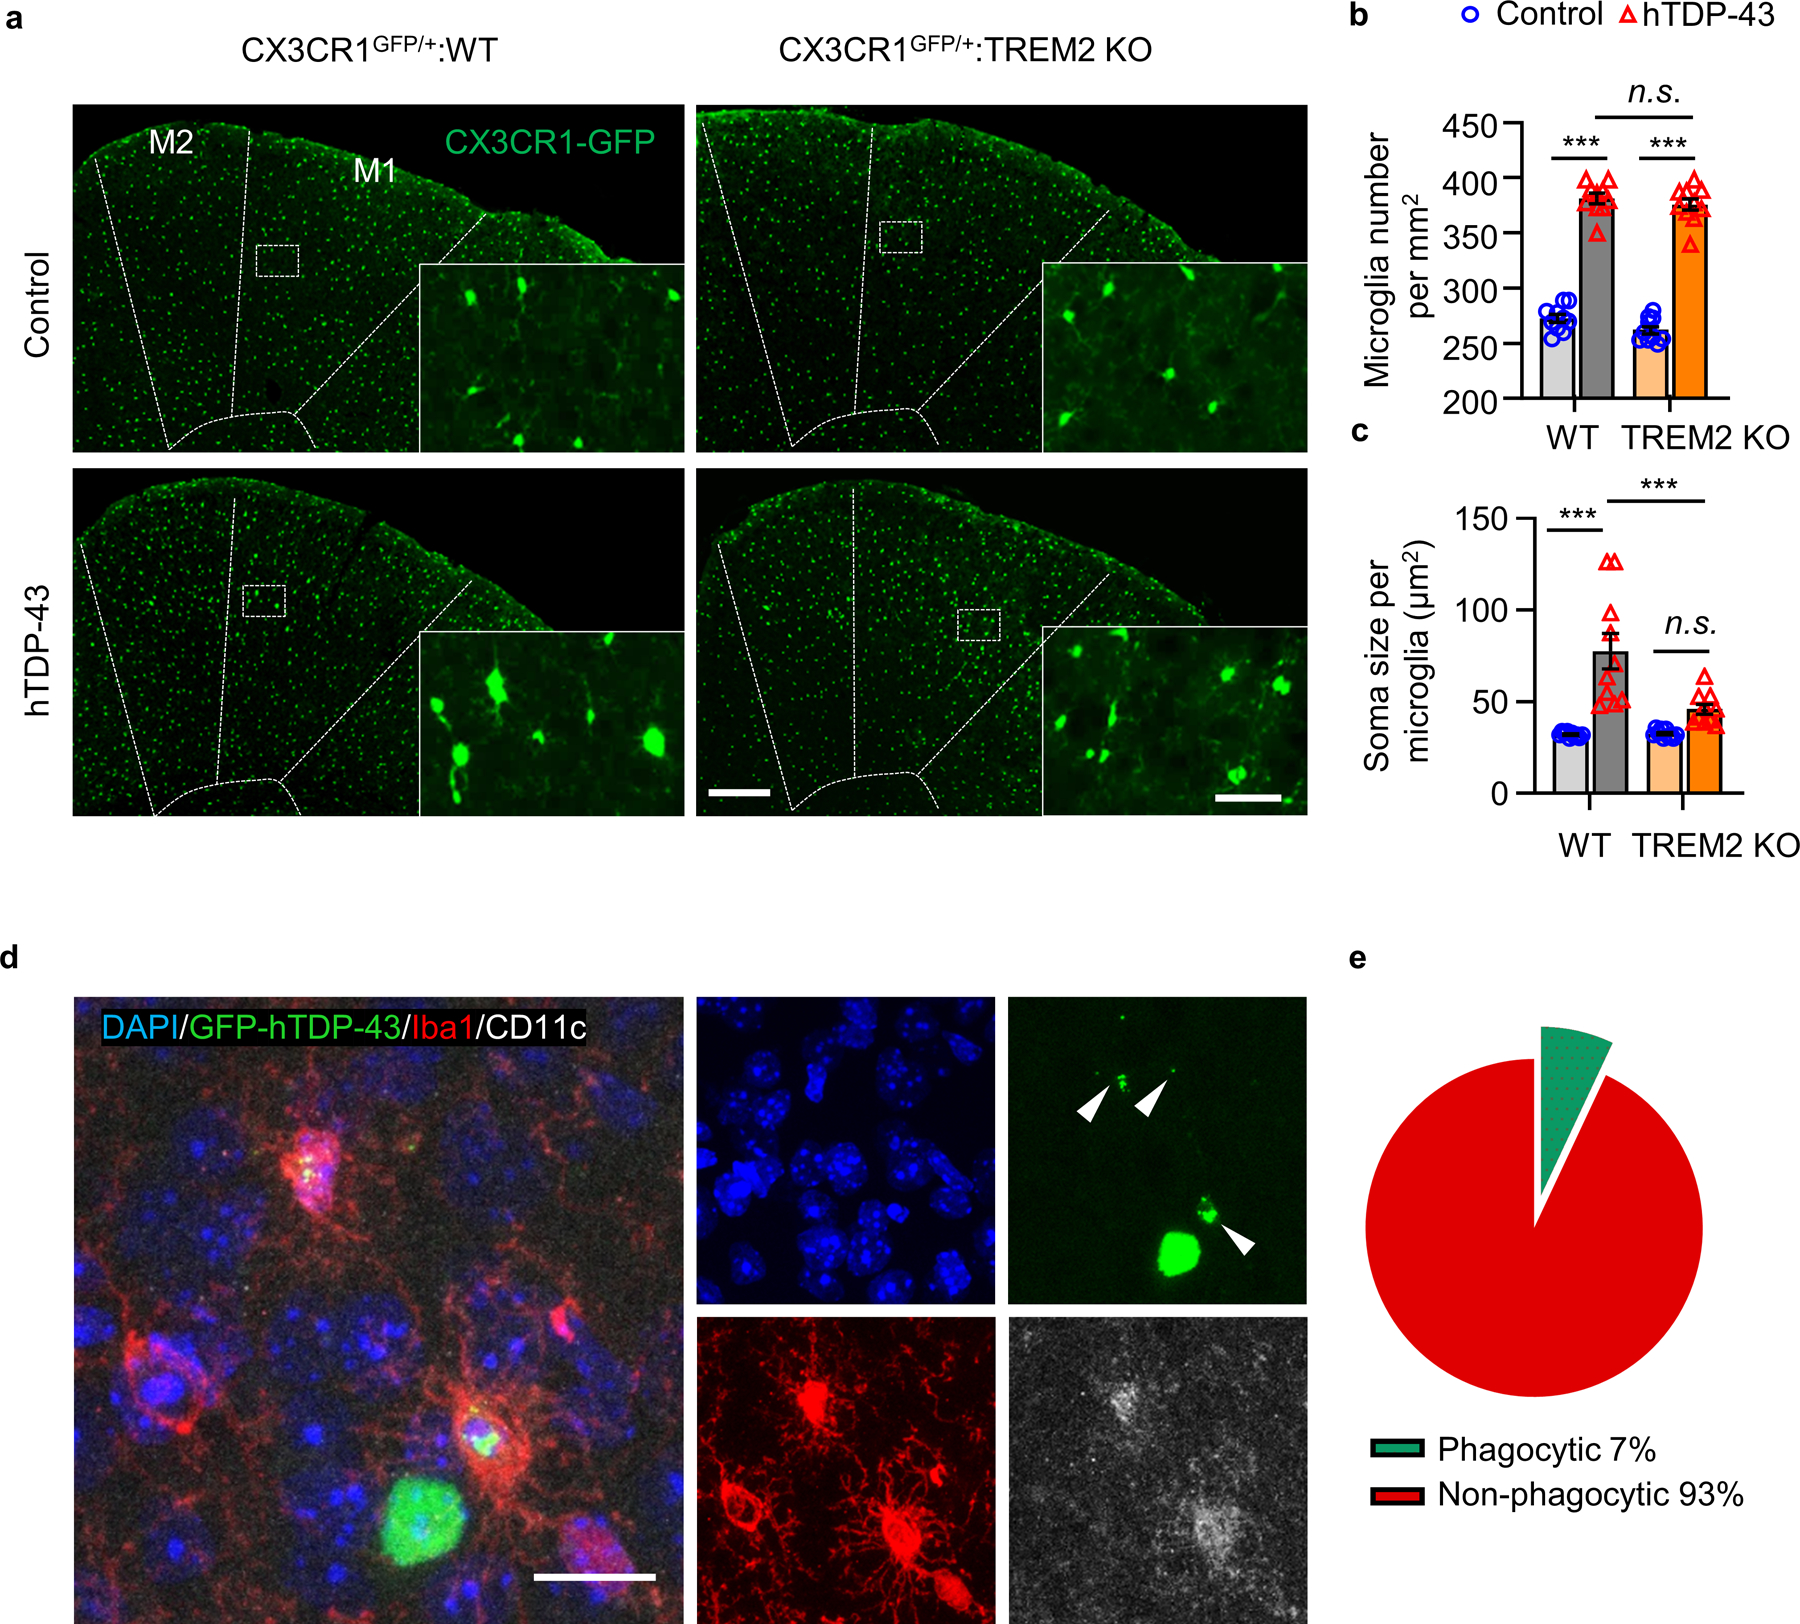
Extended Data Fig. 5. TREM2 deficiency attenuates hTDP-43-induced microglial activation.

hTDP-43 protein expression was induced via intracerebroventricular injection of AAV9.CAG.hTDP-43 in neonatal mouse (AAV9.CAG.Empty as control). a-c, Representative images (a) and quantification of GFP-expressing microglia number (b) and soma size (c) in the primary motor cortex of indicated groups at 35 dpi. M1 and M2 are separated by dashed line. Scale bar, 200 μm. Insets show microglia at higher magnification as indicated by the area in white box. Scale bar, 50 μm. d, Representative images of co-localization of CD11c (white) with Iba1 (red) in microglia phagocytosing GFP-hTDP-43 (green) in the primary motor cortex of WT group at 35 dpi. White arrowheads indicate phagocytic puncta of GFP-hTDP-43. Scale bar, 20 μm. e, Pie chart representing the percentage of microglia phagocytosing GFP-hTDP-43 (green, phagocytic microglia) and those non-phagocytic microglia in d. In b and c, Significance was calculated using two-way ANOVA followed by Tukey’s post hoc test. Data represented as mean ± SEM. n.s., not significant, *P < 0.05, **P < 0.01, *** P < 0.001. b, n = 10 per group, P < 0.0001, F 3,27 = 283.9; c, n = 10 per group, P < 0.0001, F 3,27 = 19.59.
