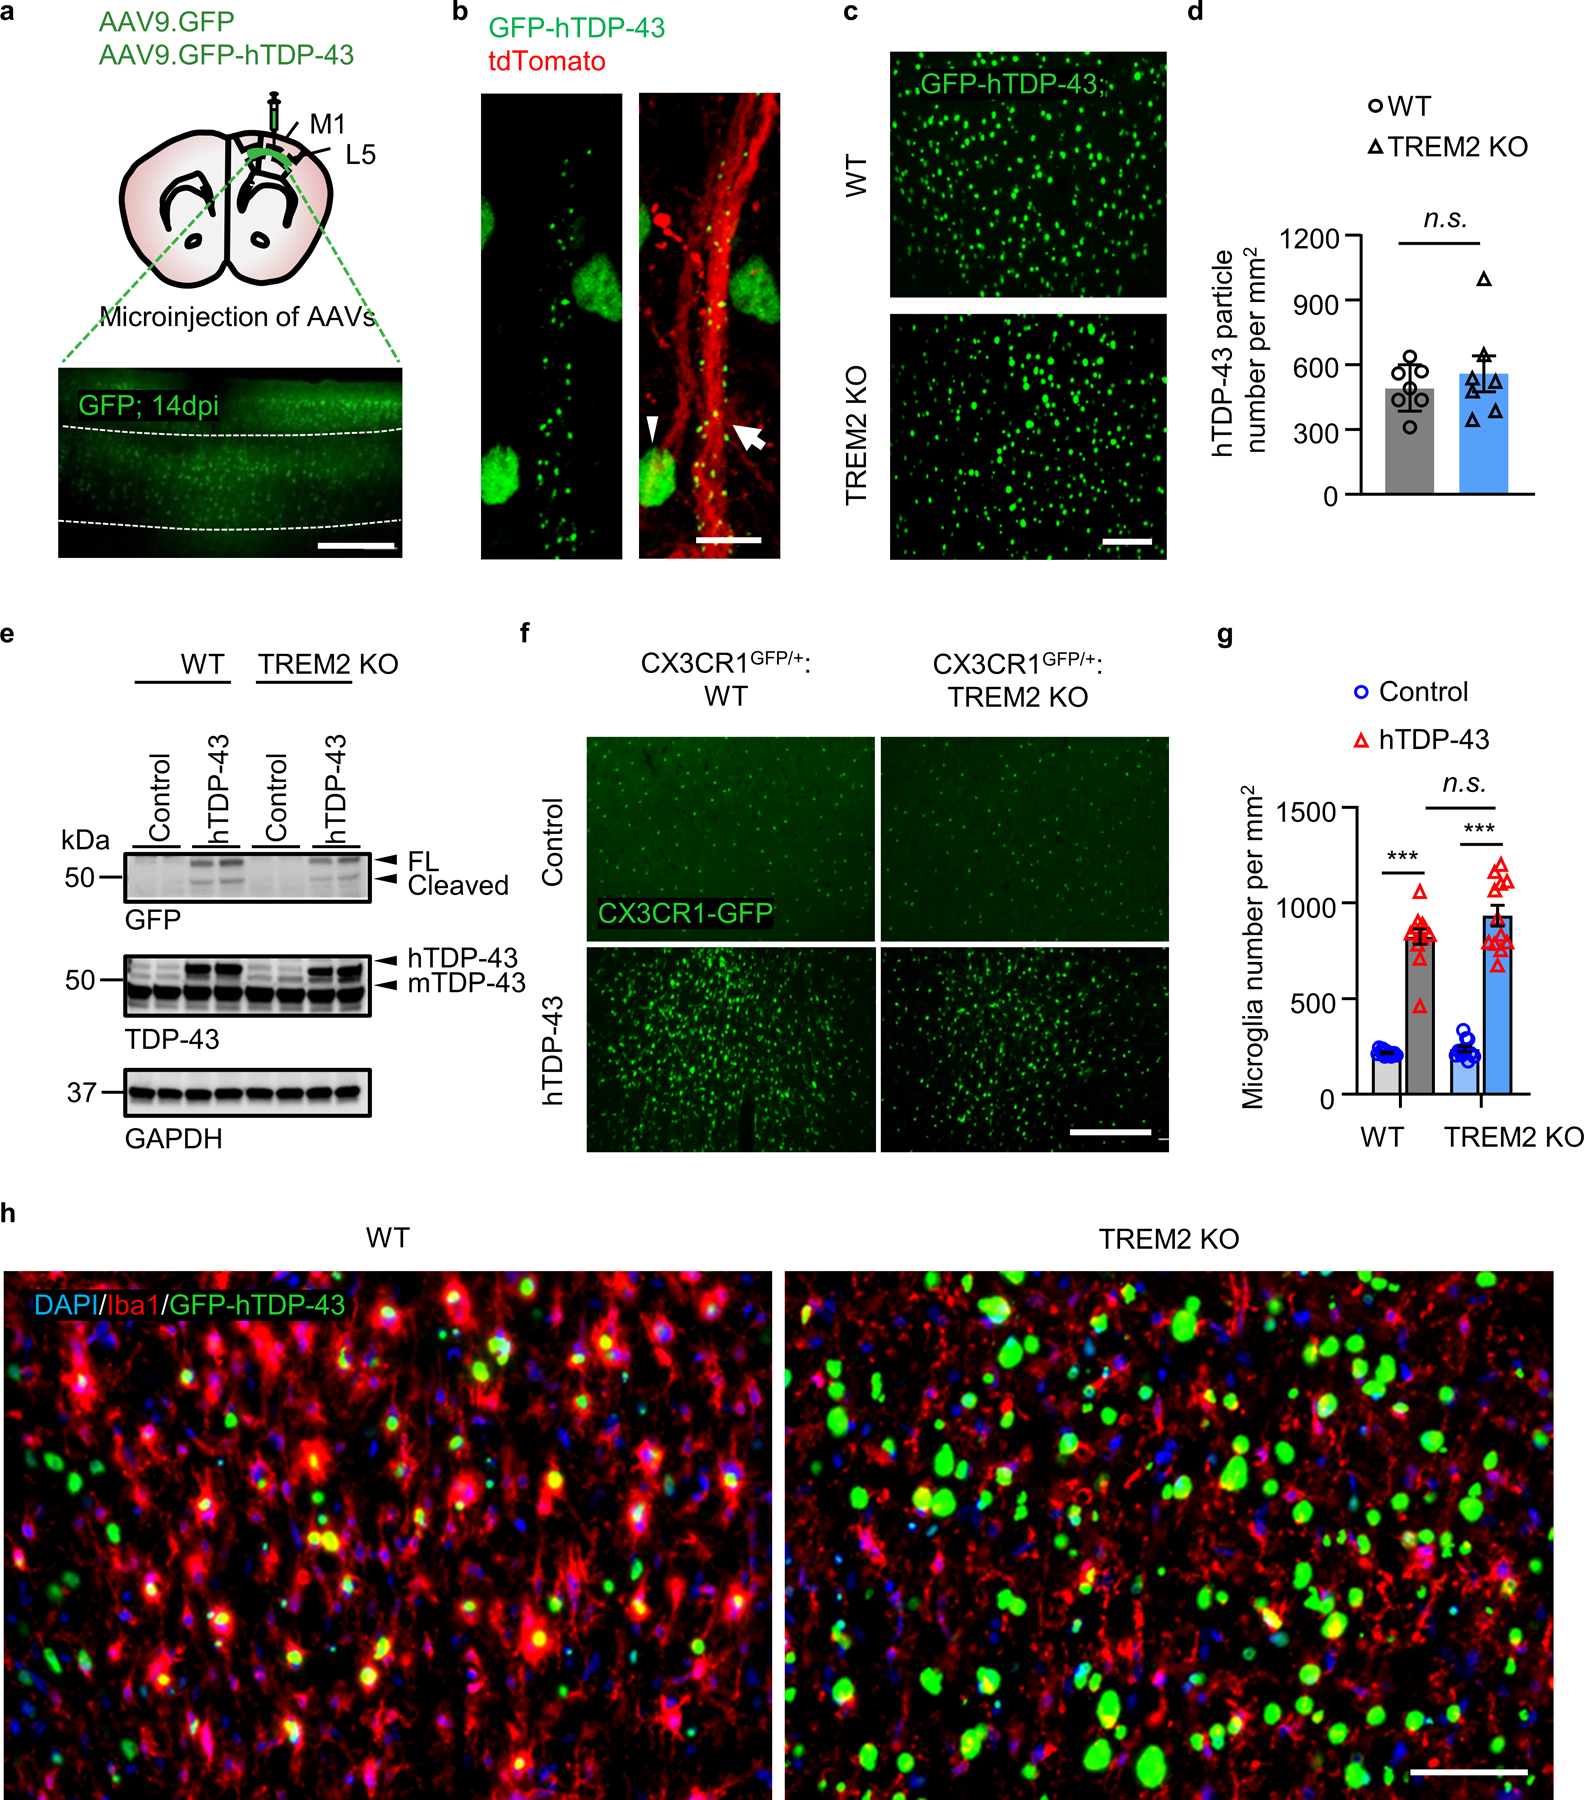
Extended Data Fig. 6. Characterizations of hTDP-43 expression mouse model via local virus injection in the primary motor cortex of adult mice.

GFP-hTDP-43 or hTDP-43 was expressed in the primary motor cortex of 2-month-old mice via stereotactic intracerebral injection of AAV9.CAG.hTDP-43.GFP or AAV9.CAG.hTDP (AAV9.CAG.GFP or AAV9.CAG.Empty as control). a, Schematic picture showing stereotactic virus injection site (upper). Representative image of GFP expression in the primary motor cortex of 2-month-old WT mice at 14 dpi (lower); Dashed lines indicate the borders of layer 4&5. Scale bar, 100 μm. b, Representative images of GFP-hTDP-43 expression in neuronal nuclei (white arrowhead) and diffusely in dendrites (white arrow) in motor cortex of WT mice at 14 dpi. AAV1.CAG.tdTomato virus was co-injected to visualize neurons. Scale bar, 5 μm. c,d, Representative images (c) and quantification (d) of GFP-hTDP-43 expression in the primary motor cortex of WT and TREM2 KO mice at 14 dpi. Scale bar, 100μm. e, GFP-hTDP-43 immunoblots of primary motor cortex of WT and TREM KO mice at 14 dpi. Western blots were independently repeated four times (n = 8 per group). GAPDH was used as loading control. f,g, Representative images (f) and quantification (g) of GFP-expressing microglia in the primary motor cortex of indicated groups at 14 dpi. Scale bar, 100μm. h, Representative images of microglia (Iba1, red) phagocytosing GFP-hTDP-43 (green) in the primary motor cortex of indicated groups at 28 dpi. Scale bar, 100 μm. Significance was calculated using either two-tailed unpaired Student’s t-test (d) or two-way ANOVA, Tukey’s post-hoc analysis (g). Data represented as mean ± SEM. n.s. =, not significant, *P < 0.05, **P < 0.01, *** P < 0.001. d, n = 7 per group, P = 0.4802, t = 0.7286, d.f. = 12; g, n = 12 per group, P < 0.0001, F 3,33 = 133.4.
