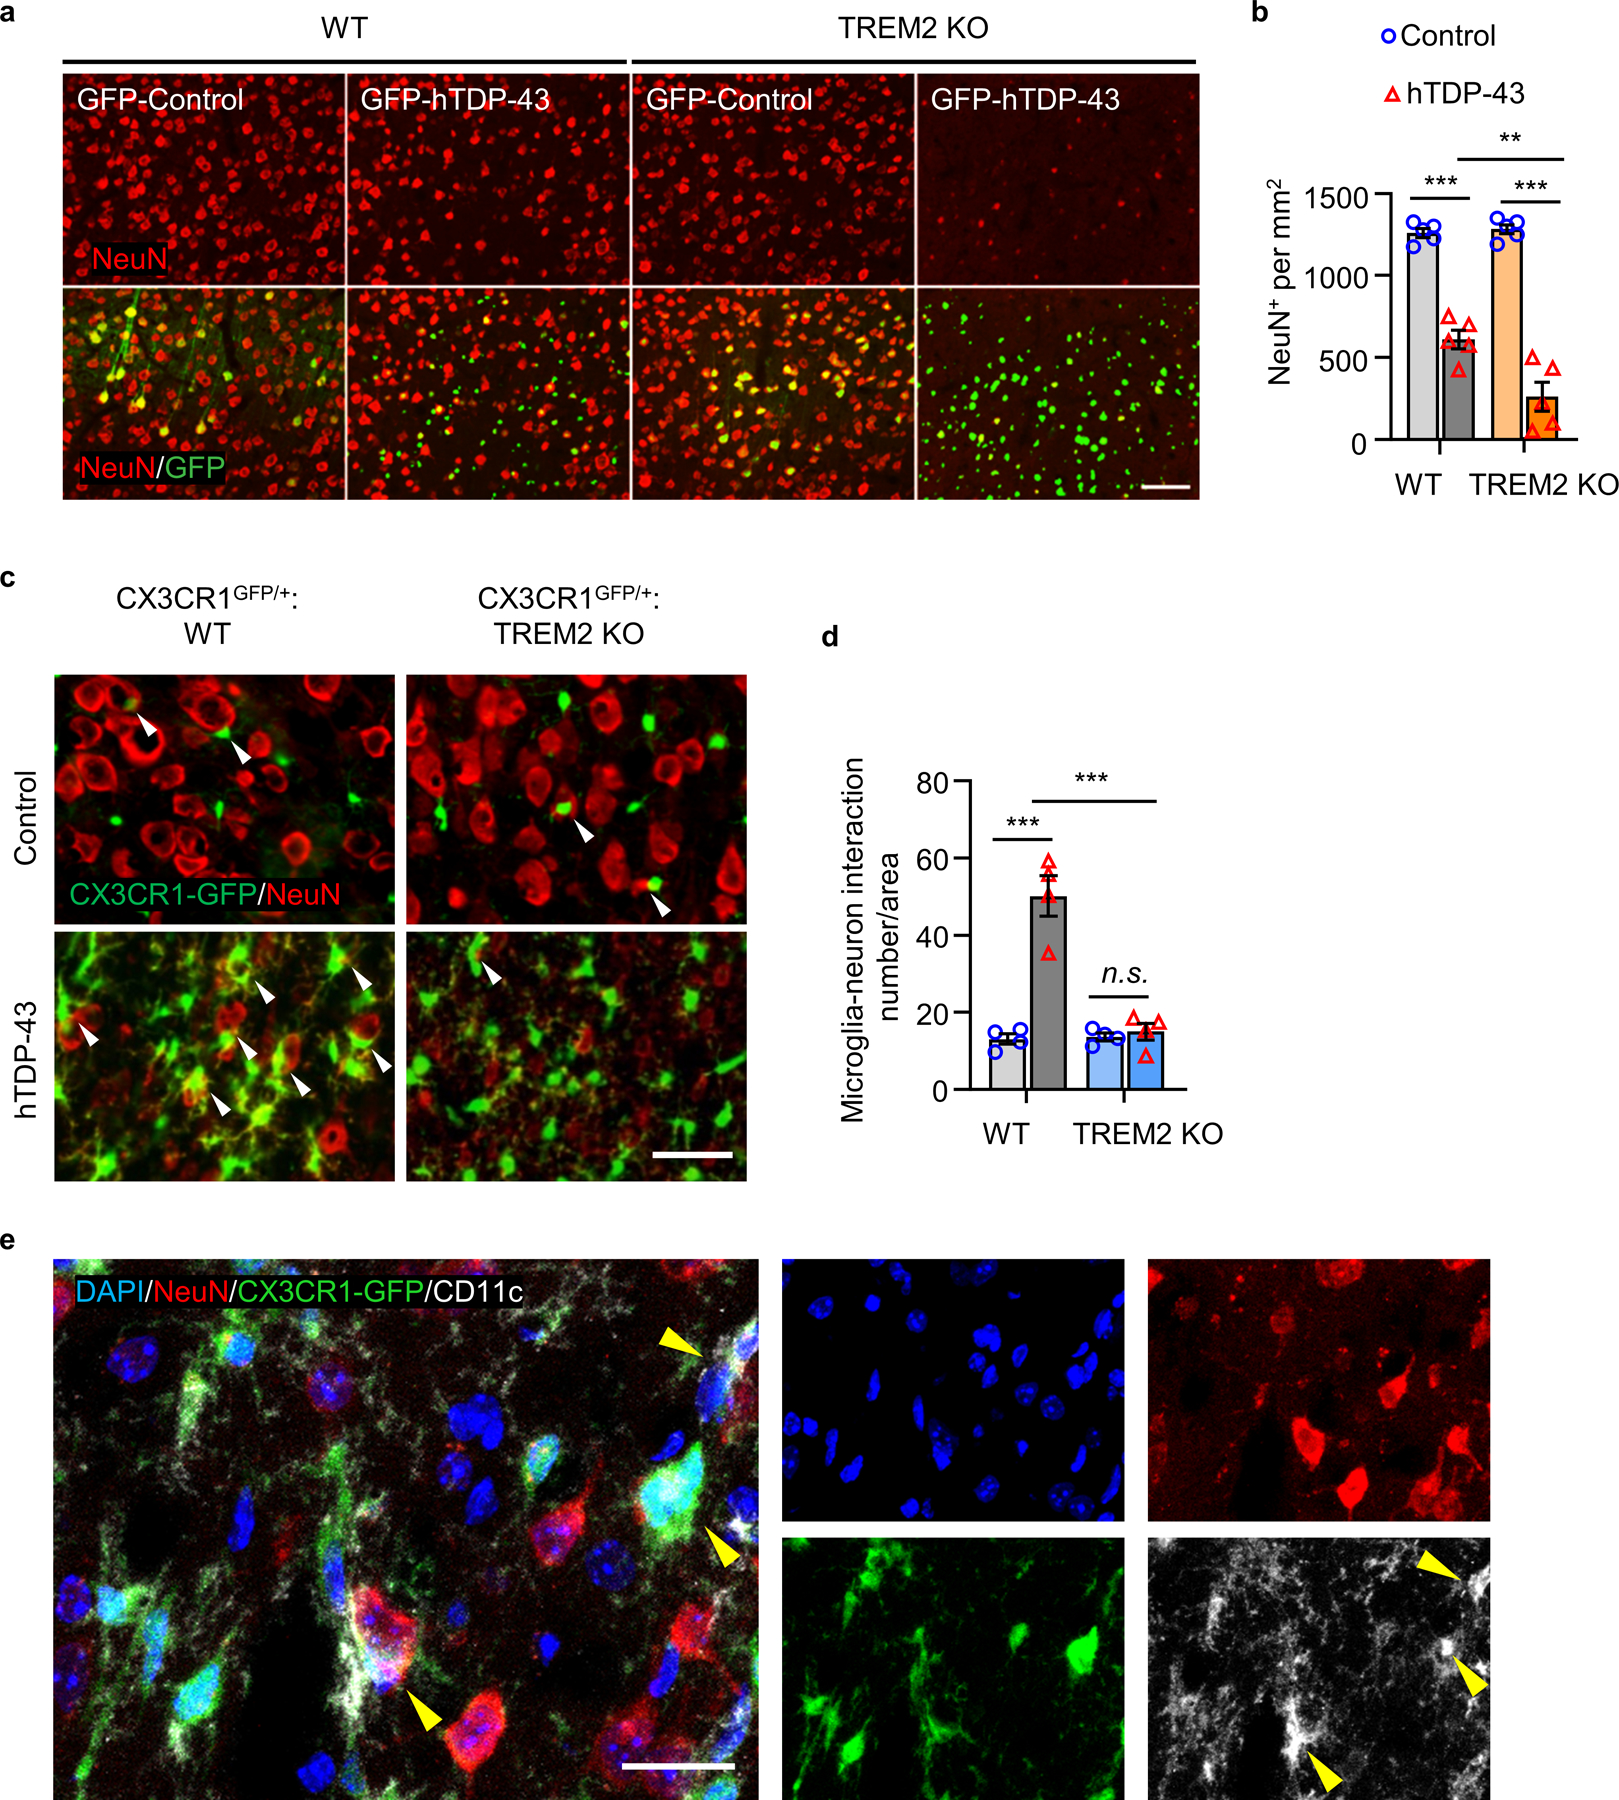
Extended Data Fig. 7. TREM2 deficiency facilitates hTDP-43-induced neurodegeneration.

GFP-hTDP-43 or hTDP-43 was expressed in the primary motor cortex of 2-month-old mice via stereotactic intracerebral injection of AAV9.CAG.hTDP-43.GFP or AAV9.CAG.hTDP (AAV9.CAG.GFP or AAV9.CAG.Empty as control). a,b, Representative images (a) and quantification (b) of NeuN immunostaining (red) in the primary motor cortex of indicated groups at 28 dpi. Scale bar, 100 μm. c,d, Representative images (c) and quantification (d) of microglia (GFP) interaction with NeuN+ neurons (red) in the primary motor cortex of indicated groups at 28 dpi. Scale bar, 50 μm. e, Representative images of CD11c (white) expression in microglia (CX3CR1-GFP, green) interacting with NeuN+ neurons (red) in the primary motor cortex of WT groups at 28 dpi. Scale bar, 20 μm. In b and d, Significance was calculated using two-way ANOVA followed by Tukey’s post hoc test. Data represented as mean ± SEM. n.s., not significant, *P < 0.05, **P < 0.01, *** P < 0.001. b, n = 5 per group, P < 0.0001, F 3,12 = 60.56; d, n = 4 per group, P < 0.0001, F 3,9 = 34.58.
