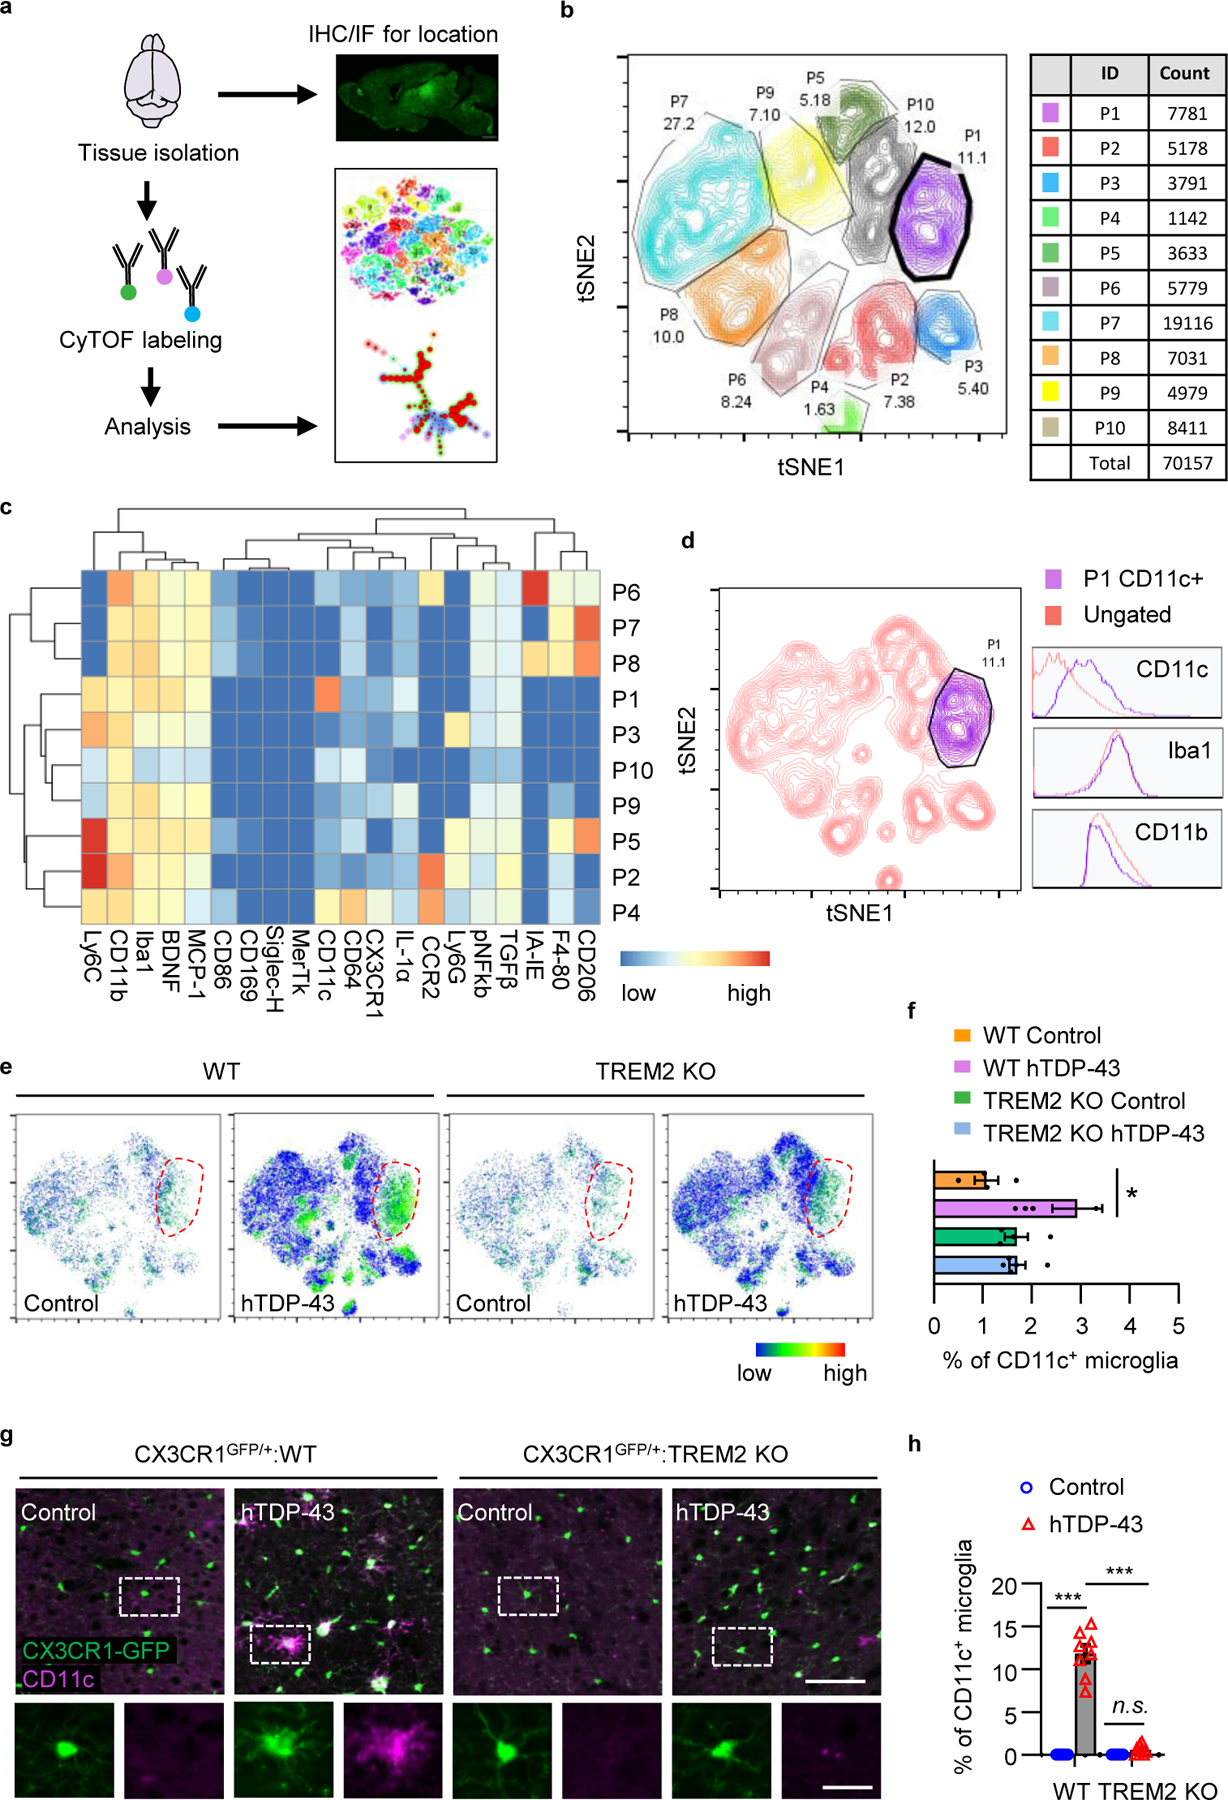
Fig 2. TREM2 deficiency abolishes hTDP-43-induced CD11c+ microglia subpopulation.

hTDP-43 protein expression was induced via intracerebroventricular injection of AAV9.CAG.hTDP-43 in neonatal mice (AAV9.CAG.Empty as control). a, Schematic workflow for cytometry by time of flight mass spectrometry (CyTOF). b, t-SNE map displaying 70157 CD45medCD11b+ microglia from 20 mice brain of 4 indicated groups at 35 dpi. Colors correspond to FlowSOM-guided clustering of microglia subpopulations. c, Heat map shows the expression levels of markers used for the microglia subpopulation analysis. Heat colors of expression levels have been scaled for each marker (blue, low expression; red, high expression). d, Single-cell t-SNE map highlights CD11c+ microglia sub-population. The histogram panels show the expression of CD11c, Iba1 and CD11b. e, t-SNE map reveals a unique CD11c+ microglia sub-population indicated by dotted circle in WT mice expressing hTDP-43 at 35 dpi. The color code shows the expression level of CD11c (blue, low expression; red, high expression). f, Frequency analysis of CD11c+ microglia based on manual gating of indicated groups at 35 dpi. g, Representative images (g) and quantification (h) of CD11c (purple) expression by immunostaining in the primary motor cortex of indicated groups at 35 dpi. Scale bar, 100 μm. High magnification images as indicated by area in dotted white box showing at the bottom. Scale bar, 10 μm. In f and h, Significance was calculated using two-way ANOVA followed by Tukey’s post hoc test. Data represented as mean ± SEM. n.s., not significant, *P < 0.05, **P < 0.01, *** P < 0.001. f, n = 4 for control groups; n = 6 for WT group with hTDP-43; n = 5 for TREM2 KO group with hTDP-43, P = 0.0146, F 3,10 = 5.807; h, n = 8 per group, P < 0.0001, F 3,21 = 140.9.
