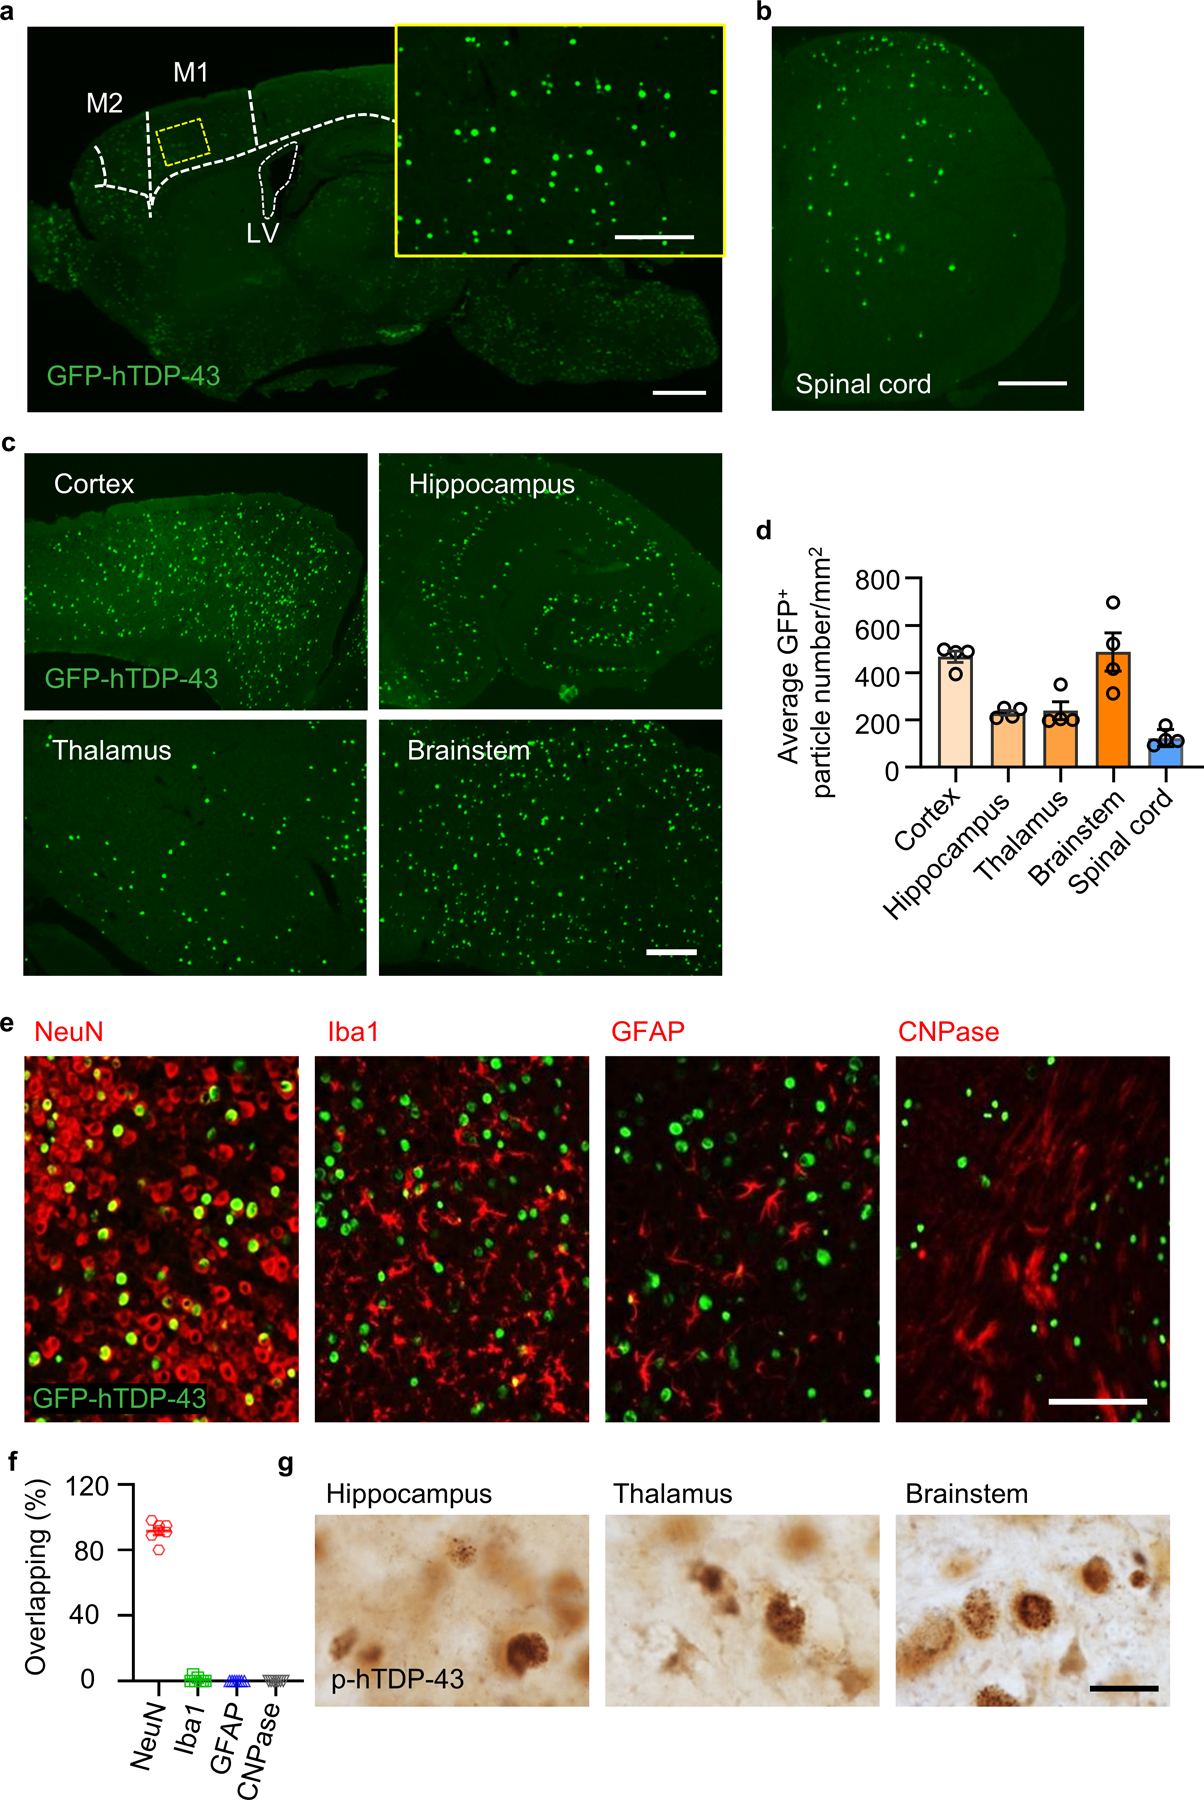
Extended Data Fig. 1. Characterizations of GFP-hTDP-43 expression in a neonatal TDP-43 mouse model.

GFP-hTDP-43 expression was induced via intracerebroventricular injection of AAV9.CAG.hTDP-43.GFP in C57/BL6 (WT) neonatal mice. a, Representative image of brain GFP-hTDP-43 expression in WT mice at 21 days post-infection (dpi). Primary motor cortex (M1), supplementary motor area (M2) and lateral ventricle (LV) are separated by dashed line. Scale bar, 500 μm. Inset shows hTDP-43 expression at higher magnification as indicated by the area in dotted yellow box. Scale bar, 100 μm. b, Representative image of spinal cord (SC) GFP-hTDP-43 expression in WT mice at 21 dpi. Scale bar, 200 μm. c, Representative image (c) and quantification (d, n = 4) of GFP-hTDP-43 expression in the brain regions of cerebral cortex, hippocampus, thalamus and brainstem in WT mice at 21 dpi. Scale bar, 100 μm. e,f, Representative images (e) and quantification (f, n = 7) of co-immunostaining of GFP-hTDP-43 (green) with neuron marker NeuN (red), microglia marker Iba1 (red), astrocyte marker GFAP (red), and oligodendroglia marker CNPase (red) in the primary motor cortex of WT mice at 21 dpi. Scale bar, 100 μm. g, Representative images of p-hTDP-43 expression in the brain regions of hippocampus, thalamus, brainstem at 35 dpi. Scale bar, 20 μm. In d and f, data represented as mean ± SEM.
