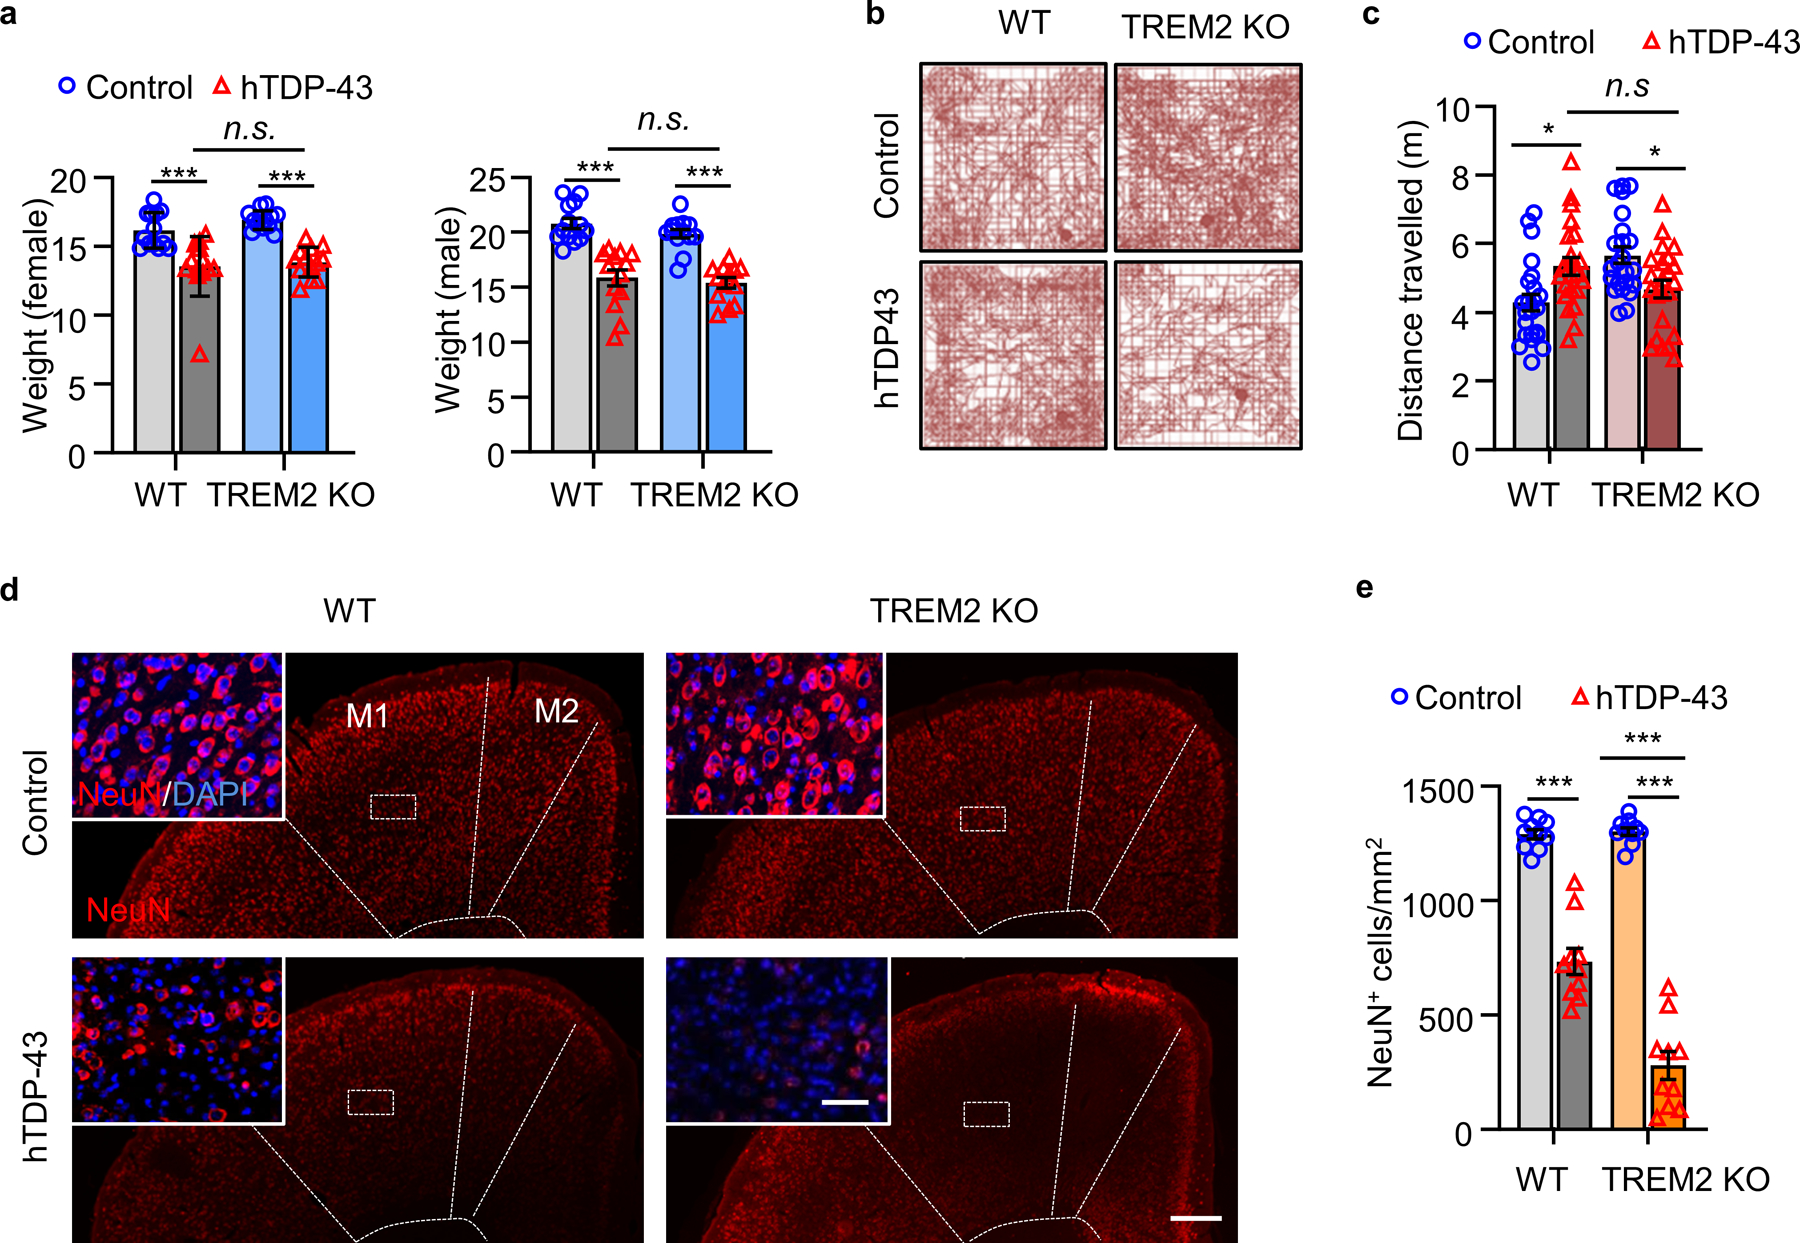
Extended Data Fig. 2. Characterizations of motor deficits and neuronal loss in a neonatal TDP-43 mouse model.

GFP-hTDP-43 expression was induced via intracerebroventricular injection of AAV9.CAG.hTDP-43.GFP in neonatal mice (AAV9.CAG.GFP as control). a, Body weights were measured separately for male and female of indicated groups at 35 dpi. b,c, Representative traces (b) and quantification (c) of locomotor activity in an open field test of indicated groups at 35 dpi. d,e, Representative immunostaining images (d) and quantification (e) of NeuN (red) with DAPI (blue) in the primary motor cortex of indicated groups at 35 dpi. M1 and M2 are separated by dashed line. Scale bar, 200 μm. Insets show NeuN staining in layer 5 of primary motor cortex at higher magnification as indicated by the area in dotted white box. Scale bar, 20 μm. In a, c, and e, Significance was calculated using Two-way ANOVA, Tukey’s post-hoc analysis. Data represented as mean ± SEM. n.s., not significant, *P < 0.05, **P < 0.01, *** P < 0.001. a, n = 13 per group, female: P < 0.0001, F 3,36 = 17.08; male: P < 0.0001, F 3,36 = 21.72; c, n = 25 per group, P = 0.0008, F 3,66 = 6.339; e, n = 10 per group, P < 0.0001, F 3,27 = 195.1.
