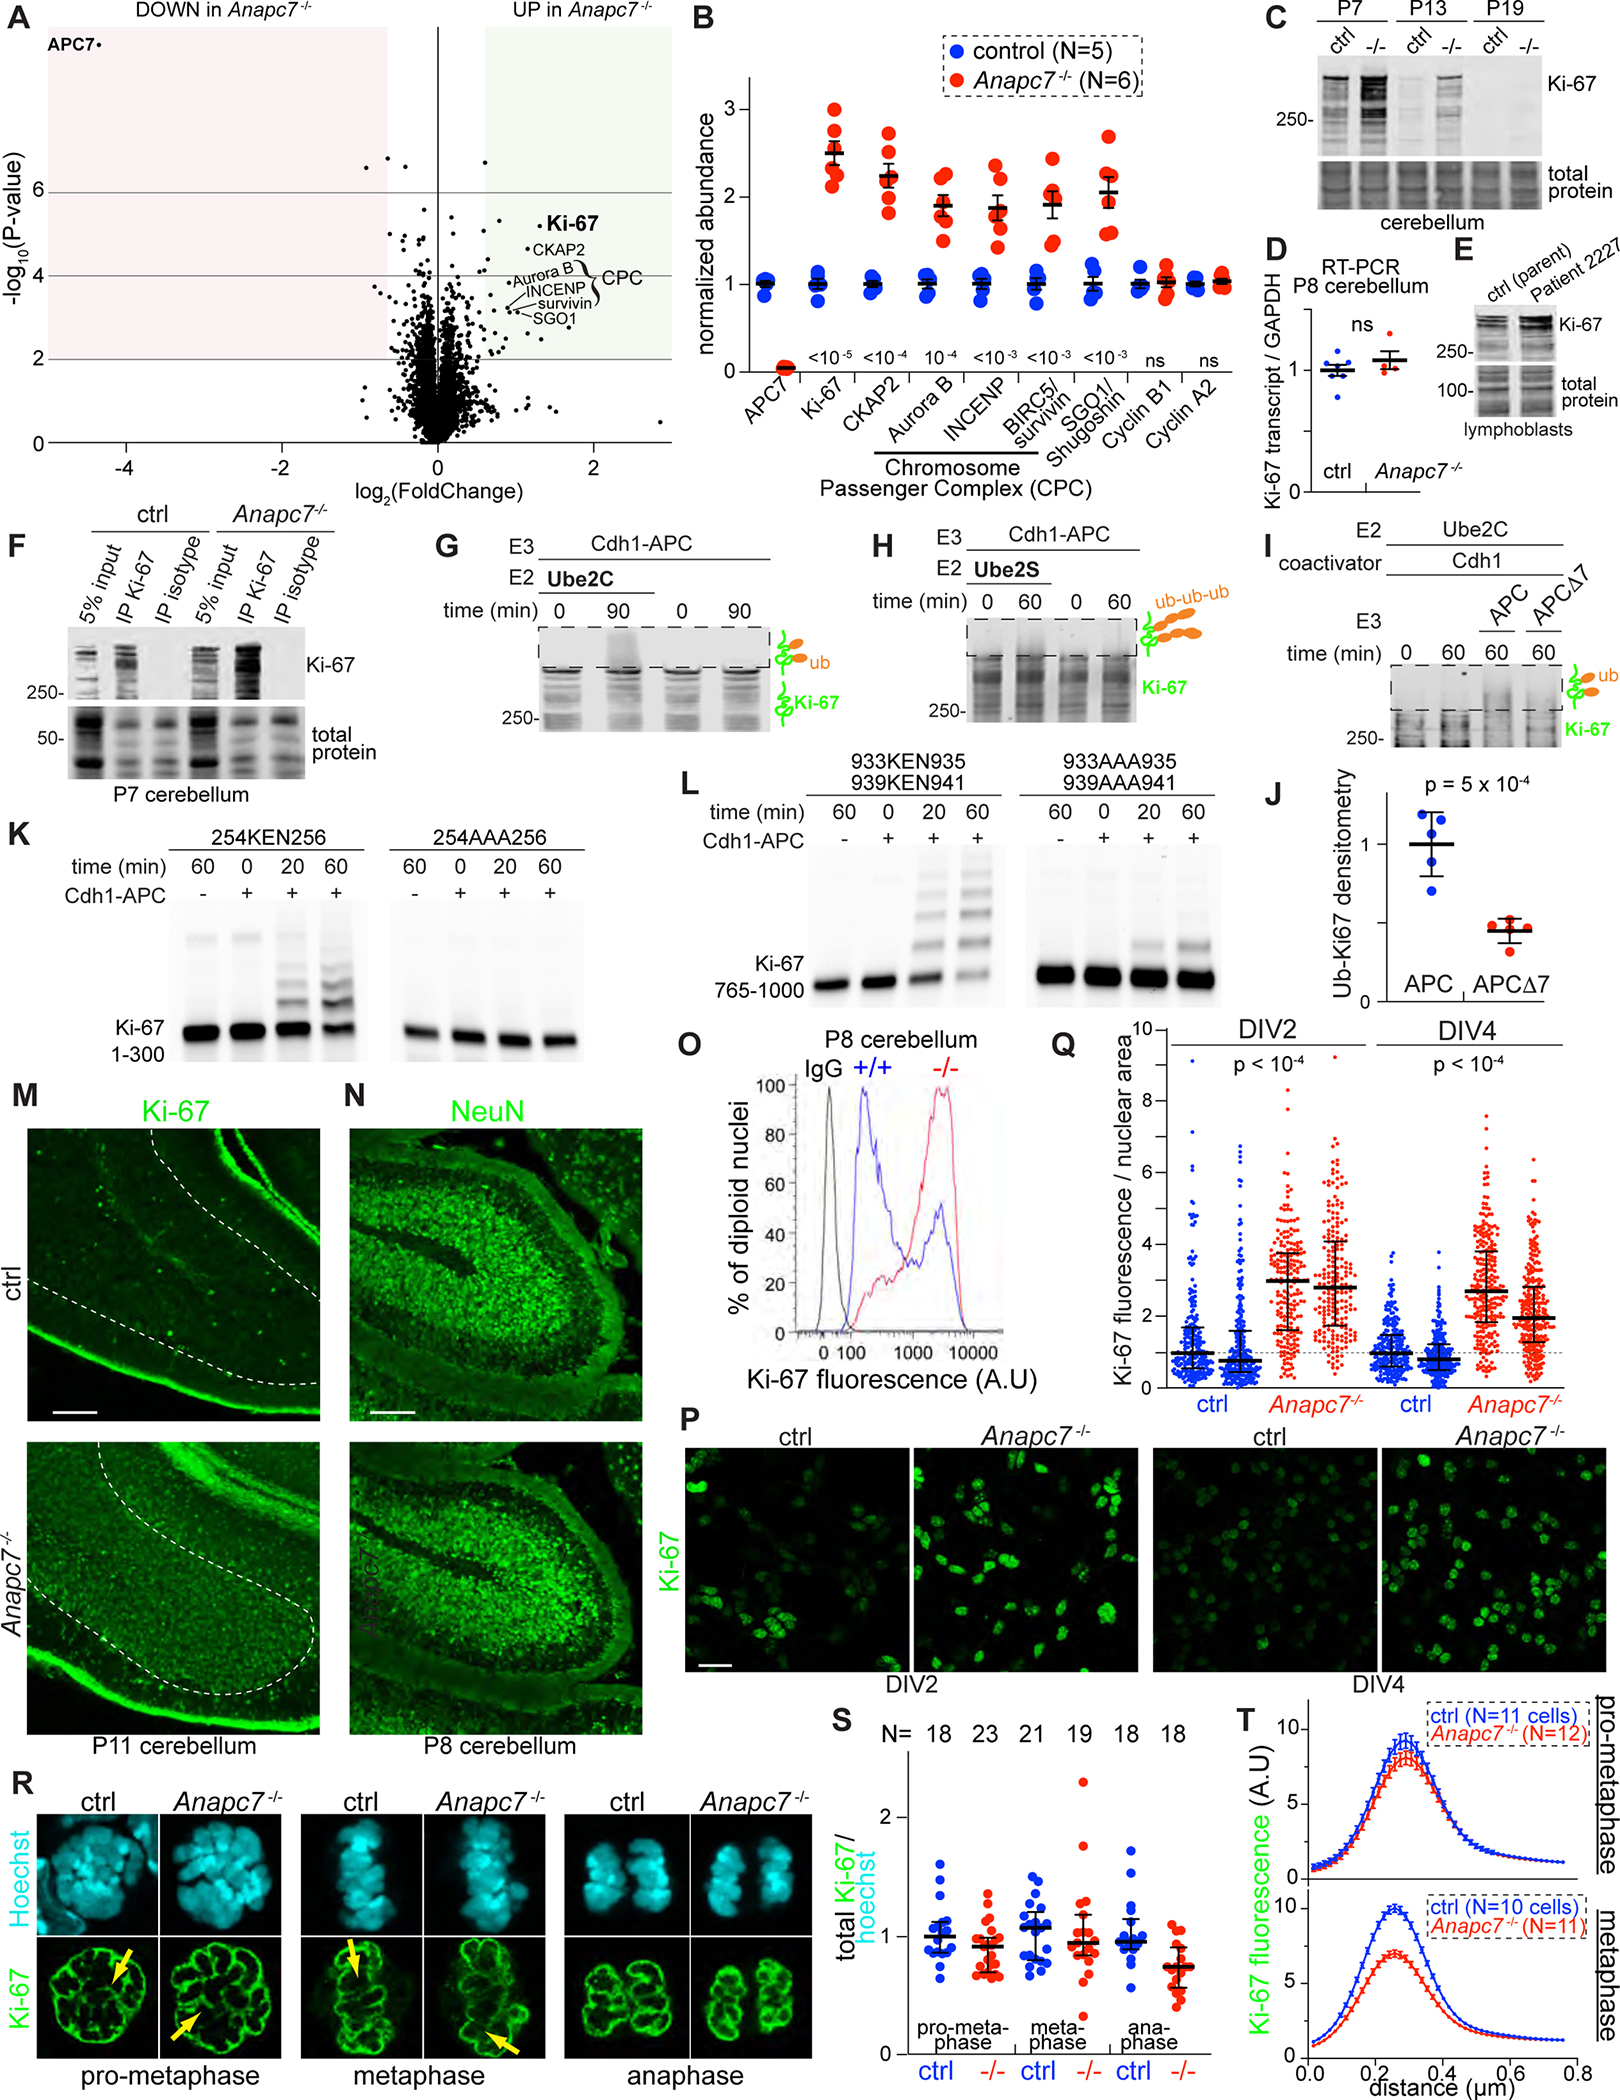
Figure 5: Identification of Ki-67 as an APC7-dependent substrate of the APC in neurons. See also Figure S7.

A. Volcano plot of protein abundance in P8 cerebellum as assessed by Tandem Mass Tag (TMT) proteomics (N=5 control, N=6 APC7 mutant). Shaded regions indicate a 1.5-fold change in abundance with p-value < 0.01 by two-tailed unpaired t-test.
B. Normalized TMT ratios for relevant proteins (p-values by two-tailed unpaired t-test).
C. Ki-67 IB in mouse cerebellum.
D. Ki-67 RT-qPCR in P8 cerebellum (N=7 control, N=4 APC7 mutant). Not significant by two-tailed unpaired t-test.
E. Ki-67 IB in human lymphoblasts.
F. IP of Ki-67 from P8 cerebellum followed by Ki-67 IB.
G. In vitro ubiquitination of Ki-67 by recombinant APC. Ki-67 was isolated by IP from wild-type P7 cerebellum. Boxed areas represent reaction products detected by Ki-67 IB.
H. In vitro polyubiquitination of Ki-67 by recombinant Cdh1-APC and Ube2S. Ki-67 was isolated by IP from wild-type P7 cerebellum.
I. In vitro ubiquitination assay using recombinant APC and APCΔ7. Ki-67 was isolated by IP from wild-type P7 cerebellum.
J. Densitometry-based measurement of reaction products following ubiquitination of immunoprecipitated Ki-67 by APC and APCΔ7. Errors bars SEM (N = 5, p-value by two-tailed unpaired t-test).
K. In vitro ubiquitination of amino acids 1–300 of human Ki-67 by recombinant APC. KEN to AAA substitution occurred at the indicated residues.
L. In vitro ubiquitination of amino acids 765–1000 of human Ki-67 by recombinant APC. KEN to AAA substitutions occurred at the indicated residues
M. Ki-67 IF in P11 cerebellum.
N. NeuN IF in P11 cerebellum.
O. Flow cytometry of diploid nuclei isolated from P8 cerebellum labeled with anti-Ki-67 or isotype antibody.
P. Confocal IF of Ki-67 in primary mouse cerebellar granule neuron cultures. The day in vitro (DIV) is indicated.
Q. Quantitation of Ki-67 in individual neuronal nuclei normalized to nuclear area. Two biological replicates are shown for each genotype and DIV. Error bars interquartile range (p-values by one-way ANOVA with Tukey test).
R. Confocal optical sections of anti-Ki-67 IF in neuronal precursors during mitosis. Yellow arrows indicate regions sampled in Figure 5T.
S. Quantitation of Ki-67 IF during mitosis. Ki-67 intensity was normalized to Hoechst. The number of cells analyzed is shown. Error bars SEM.
T. Quantitation of the intensity of the chromosome periphery. For each cell, 3–5 segments were analyzed. Errors bars SEM.
