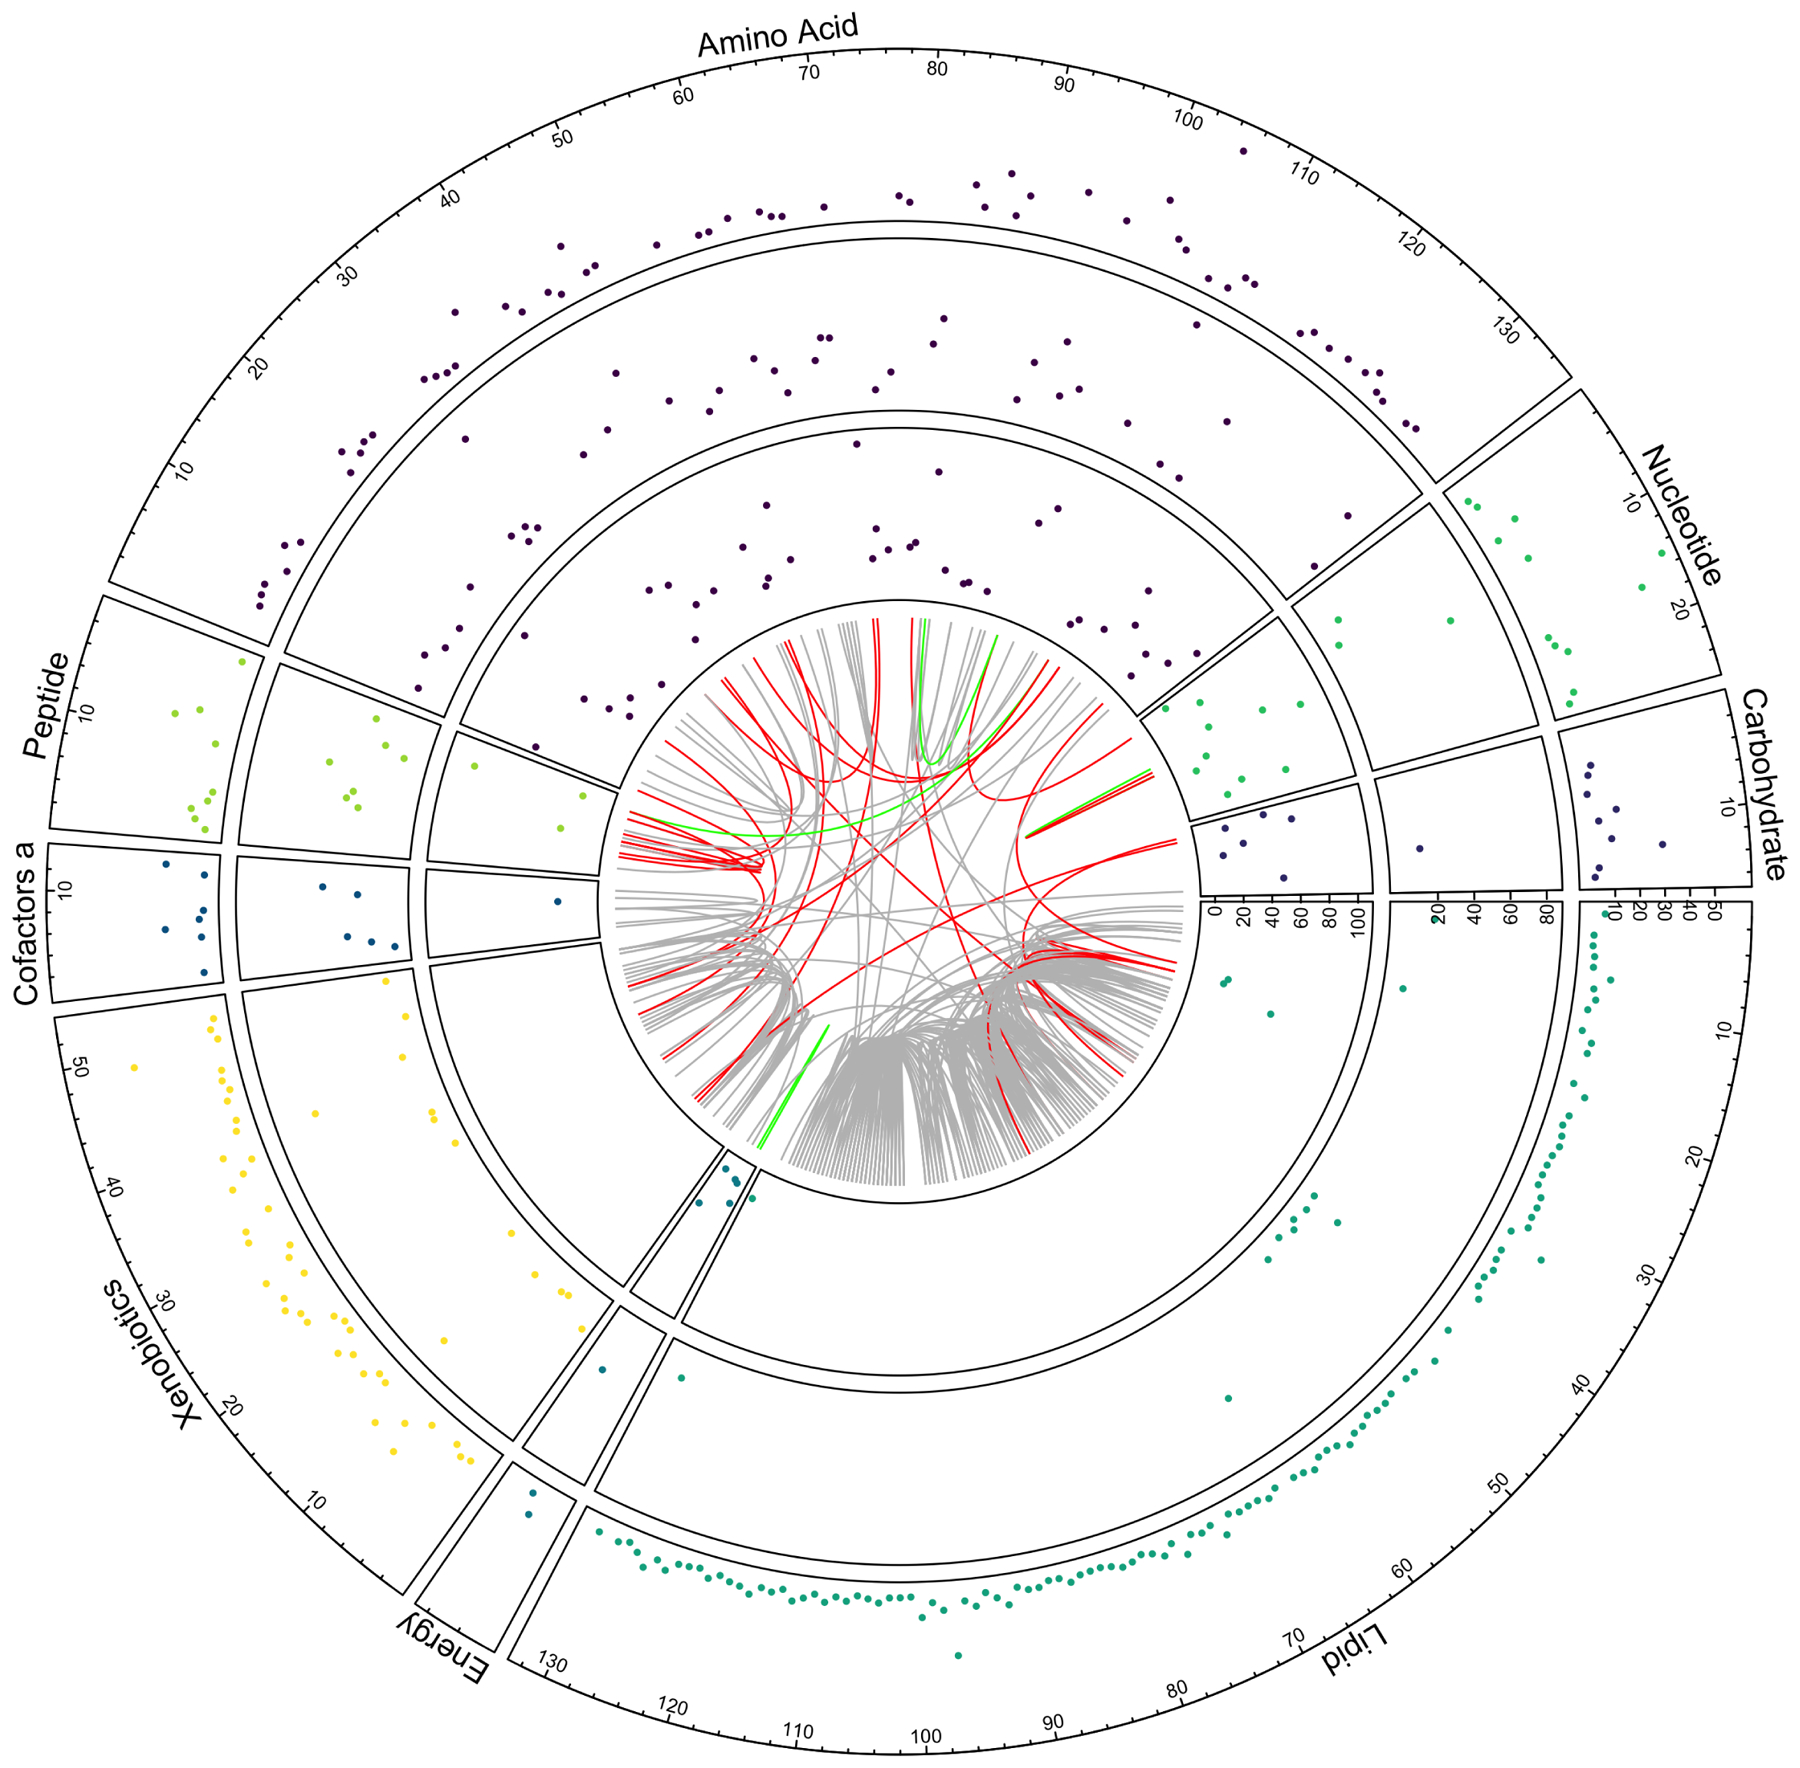
Figure 1.

Circus plot showing metabolites significantly associated with eGFR (FDR<0.05) clustered based on super pathways, with novel (outer circle), novel replicated (middle circle) and previously published associated metabolites (inner circle). Each dot is a metabolite p-value, shown as −10 log(p-value). The internal chord diagram represents the pairwise correlations among metabolites for Pearson correlation (r) >0.7 with links related to gray=two newly associated metabolite, red=previously published with newly associated metabolites, green=two previously published metabolites. Note the p-values are lower for previously published metabolites compared to newly identified metabolites.
