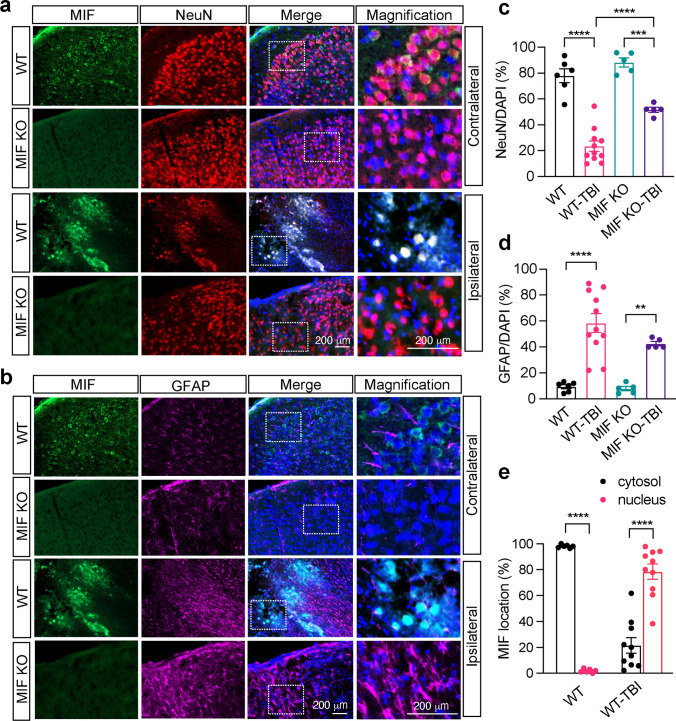
Fig. 3.
Expression of MIF in the cortex of mouse brain 1 day after TBI. Co-immunostaining of MIF/NeuN (a) and MIF/GFAP (b) in the contralateral (non-TBI) and ipsilateral brain cortex of MIF WT and KO mice next to the damage core 1 day after TBI. Quantification of relative NeuN+ neurons/DAPI per field (c) and GFAP+ astrocytes/DAPI per field (d) in the contralateral (non-TBI) and ipsilateral brain cortex of MIF WT and KO mice 1 day after TBI. Images (n = 6, n = 11, n = 5, n = 5 in order) in the contralateral and ipsilateral sides of WT and KO mice for quantification. e Quantification of the percentage of MIF localization in the cytosol and nucleus per field in the contralateral (non-TBI) and ipsilateral brain cortex of MIF WT mice 1 day after TBI. Images (n = 6 and n = 10, respectively) in the contralateral and ipsilateral sides of WT mice for quantification. Data in c–e are shown as mean ± SEM and analyzed for statistical significance by one-way ANOVA. ****p < 0.0001, ***p < 0.001, **p < 0.01

