Fig. 4.
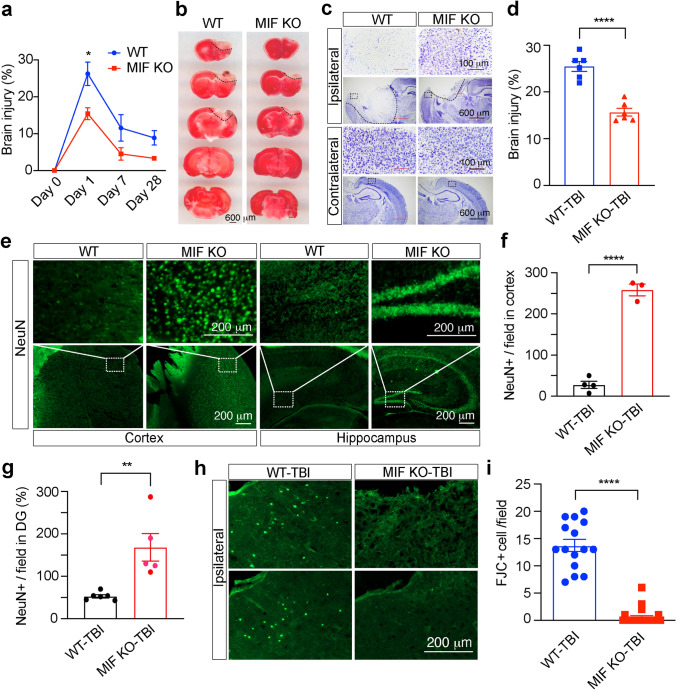
MIF KO reduced the TBI volume. a Brain injury volume at day 0 before TBI (n = 3/group for WT and KO), day 1 (n = 6/group for WT and KO), day 7 (n = 6/group for WT and KO) and day 28 (n = 18 for WT and n = 8 for KO) following TBI determined by TTC staining. Data are shown as mean ± SEM. *p < 0.05 by two-way ANOVA Sidak’s multiple comparisons test. b Representative images of TTC staining of MIF WT and KO mice 1 day after TBI. Representative images (c) and injury quantification (d) of Nissl staining with MIF WT and KO mice 1 day after TBI. n = 6 mice per group. ****p < 0.0001. NeuN staining (e) and quantification (f, g) in the cortex next to the TBI site of MIF WT and KO mice (e, left two panels) and hippocampus (e, right two panels). Images [n = 4 (WT-TBI in f), n = 3 (KO-TBI in f), n = 6 (WT-TBI, g), n = 5 (KO-TBI, g)] from 3 pairs of MIF WT and KO mice for quantification. Fluoro-Jade C (FJC) staining (h) and quantification (i) in the cortex of MIF WT and KO mice 7 days following TBI. Images [n = 15 (WT-TBI), n = 23 (KO-TBI)] of MIF WT and KO mice for quantification. Data in a, d, f, g, i are shown as mean ± SEM and analyzed for statistical significance by two-way ANOVA (a) and unpaired two-tailed Student’s t test (d, f, g, i). ****p < 0.0001, **p < 0.01, *p < 0.05

