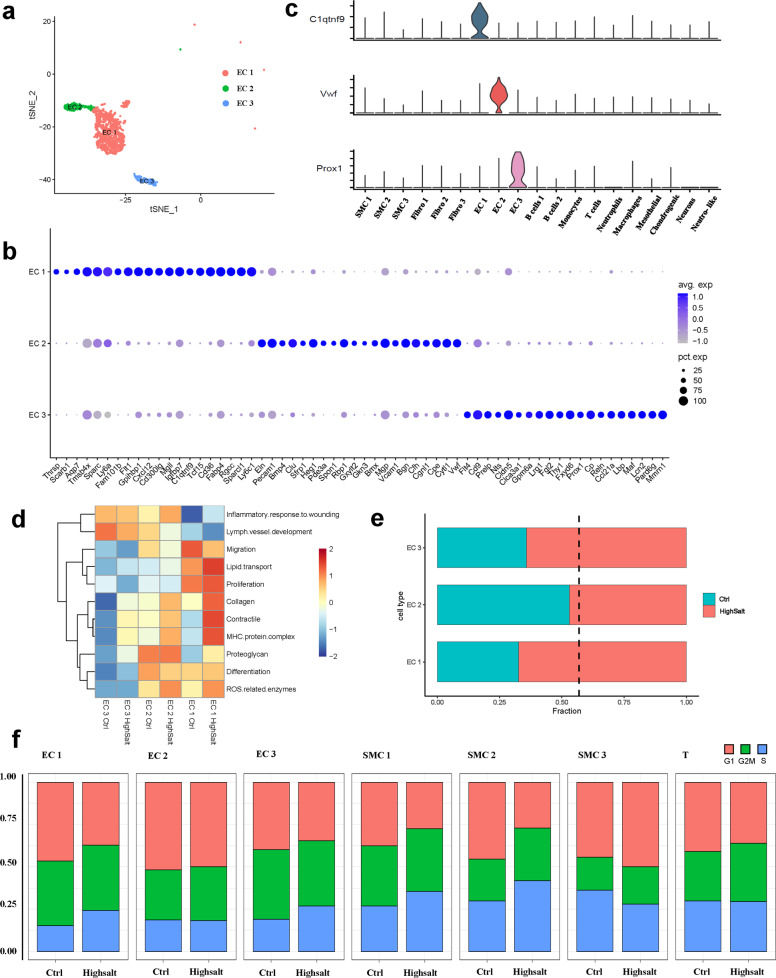
Fig. 2. Characteristics of aortic ECs and their changes in hypertension.
a t-SNE plot of the EC subpopulations from control and hypertensive tissue (control, n = 624 ECs; hypertension, n = 1056 ECs. EC 1, n = 1107 cells; EC 2, n = 302 cells; EC 3, n = 271 cells). b Expression levels of marker genes associated with 3 EC subpopulations across the 19 clusters. c Dot plot of the top 20 genes with specific expression for each EC subpopulation. d Module scores of 11 features (or functions) in control and hypertensive aortic EC subpopulations. e Bar graph of the composition of each EC subpopulation (dashed black line, expected proportion of cells in the control group). f Cell cycle stage distribution of 7 subpopulations from control and hypertensive tissue.

