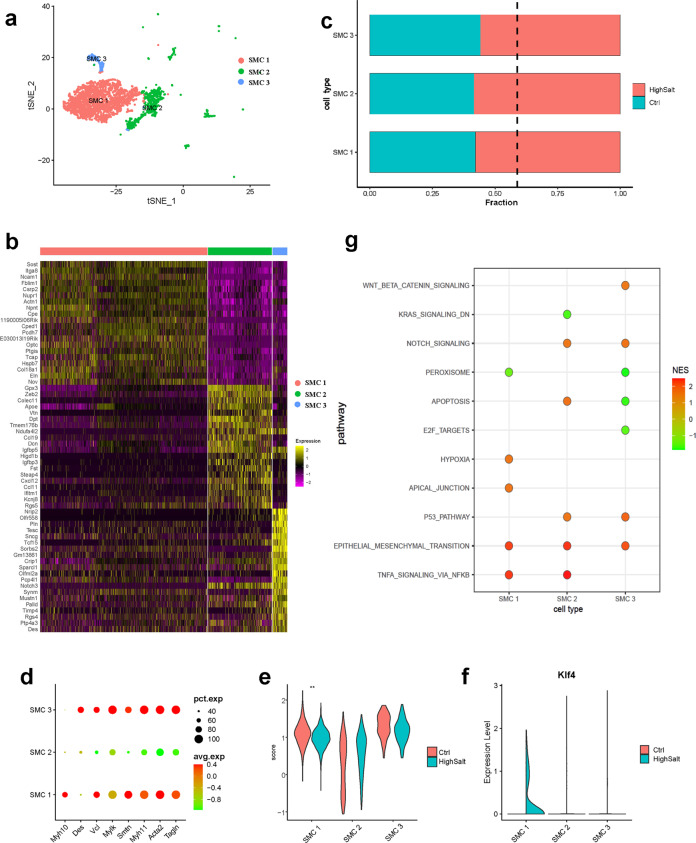
Fig. 3. Characteristics of aortic SMCs and their changes in hypertension.
a t-SNE plots of the SMC subpopulations from control and hypertensive tissue (control, n = 1422 SMCs. hypertension, n = 1949 SMCs. SMC 1, n = 2296 cells; SMC 2, n = 874 cells; SMC 3, n = 202 cells). b Heatmap showing the top 10 genes (by average log(fold change)) for each SMC cell subpopulation. c Bar graph of the composition of each SMC subpopulation (dashed black line, expected proportion of cells in the control group). d Dot plots of typical SMC markers for 3 SMC subpopulations from the control. e Expression of contractile SMC markers for 3 SMC subpopulations from control and hypertensive tissue. ***Mann–Whitney U test p < 0.001 vs. SMC 1, HighSalt. f Violin plots of the Klf4 gene associated with phenotypic modulation of SMCs. g The results of gene set enrichment analysis (GSEA) using a hallmark gene set showing enriched differentially expressed gene (DEG) counts between the control and hypertension groups.

