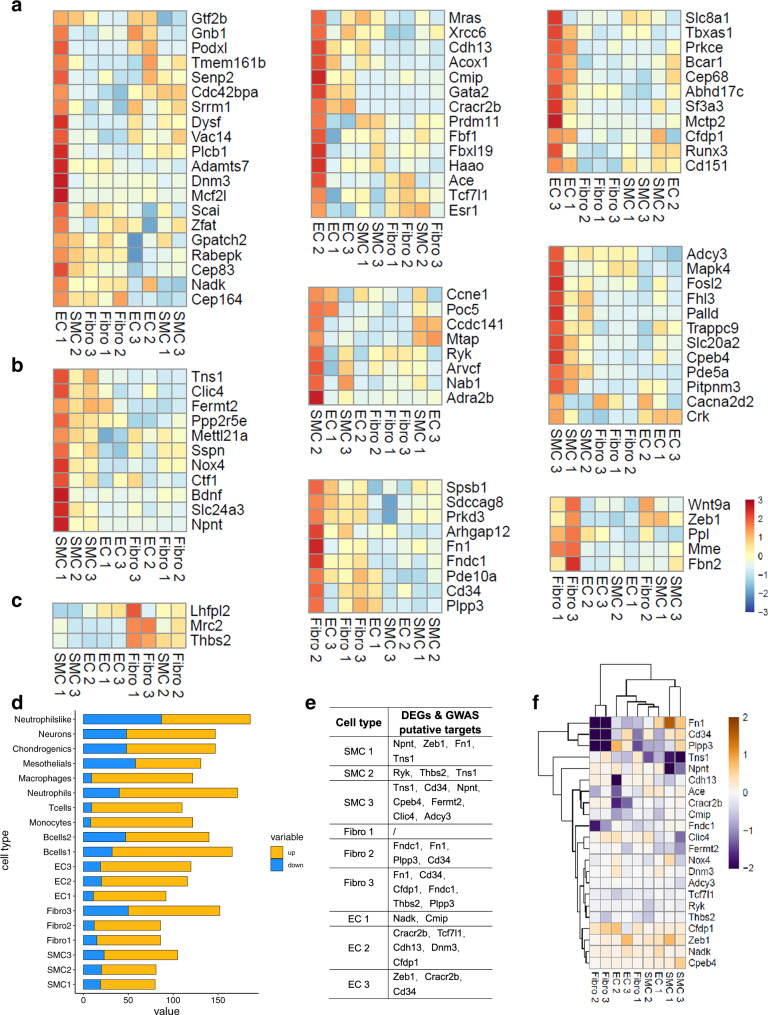
Fig. 5. Association between risk genes for high blood pressure and aortic cells.
a–c Blood pressure GWAS-related genes enriched in ECs (a), SMCs (b), and fibroblasts (c). Mean expression values of the genes calculated in each cluster. Each row is a gene, and each column represents a single cell type. d Differentially expressed gene (DEG) counts between the hypertension and control groups in each cluster (blue, downregulated genes; red, upregulated genes). e DEGs identified as blood pressure GWAS-related genes according to cell cluster. f Heatmap showing differences in the average expression of candidate genes, (e) between hypertension and control groups according to cell cluster. A higher row-scaled mean expression score indicates increased gene expression in hypertension.

