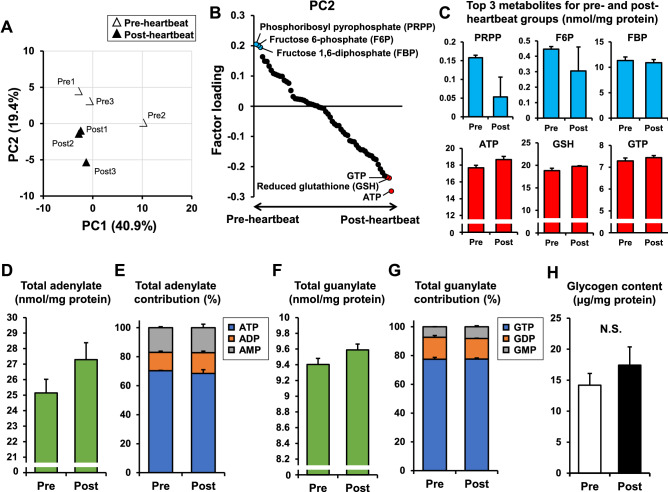
Figure 2.
Characteristics of energy metabolites in the heart primordium before and after heartbeat initiation. (A) Score plot of principal component analysis in the metabolome analysis. (B) Factor loading plot for PC2. Metabolites detected in the metabolome analysis are arranged on the X-axis in the order of factor loading. Blue dots indicate the top three metabolites showing positive factor loading and red dots indicate top three metabolites showing negative factor loading. (C) Individual values of the top three metabolites for the pre-heartbeat group (PRPP, F6P, and FBP) and for the post-heartbeat group (ATP, GSH, and GTP). (D,E) Total adenylate and its contribution that were obtained by metabolome analysis in the pre- and post-heartbeat groups. (F,G) Total guanylate and its contribution that were obtained by metabolome analysis in the pre- and post-heartbeat groups. (H) Glycogen contents assessed by a colorimetric glycogen assay in the pre- and post-heartbeat groups (N = 6). *p < 0.05 with Welch's t-test. N.S.: not significant.

