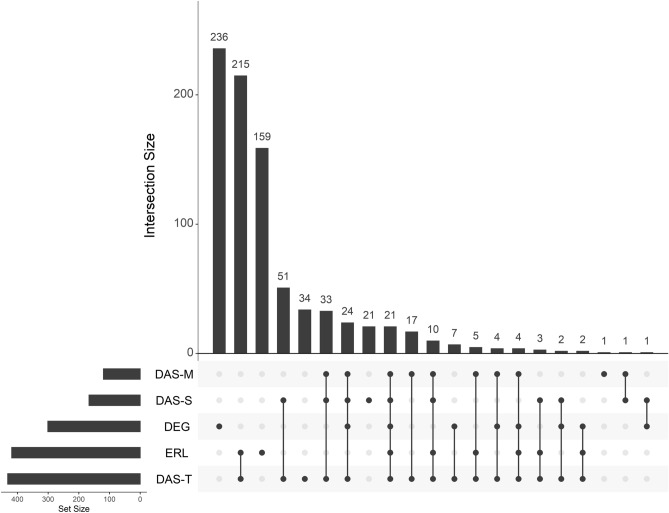
Figure 12.
Genes associated with disease severity measures are not typically differentially expressed. An UpSet plot of intersections between untreated JDM versus control PBMCs (DEG) and genes correlated with 4 disease severity clinical traits. The lower left bar plots show the total number of genes in each category. The vertical bar plot shows the intersection size. Intersections are defined by which dots are filled in and connected. Most of the differentially expressed genes are not associated with traits, and most trait-associated genes are not differentially expressed. The greatest intersection is between genes correlated with total DAS and nailfold capillary end row loop number. As far as differentially expressed genes go, the greatest overlap is a set of 24 genes that are differentially expressed and correlated with all three DAS, followed by a set of 21 genes that are differentially expressed and correlated with every clinical trait. Abbreviations: DEG, differentially expressed genes; DAS, disease activity score; ERL, nailfold capillary end row loop number.

