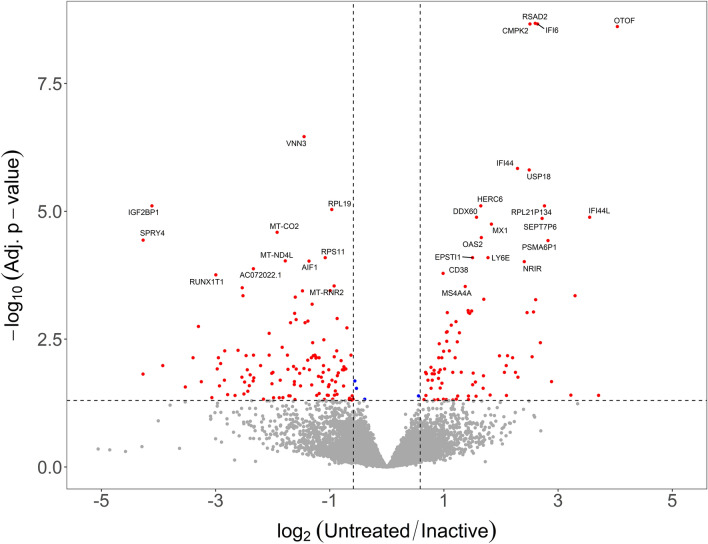
Figure 3.
Inactive JDM PMBC samples do not revert to control-like gene expression. Volcano plot with log2 fold-change on the x-axis and –log10 of the false-discovery rate corrected p value. The vertical lines indicate a minimum 1.5-fold change. The fold-change is represented as untreated/inactive. Genes that are in the upper right area were increased in untreated but resolved with inactivity. Genes in the upper left area were decreased in untreated JDM and resolved with clinical inactivity. Most genes fall below the horizontal significance cutoff line (grey dots), indicating the untreated and inactive PBMCs are not different from each other for the gene.

