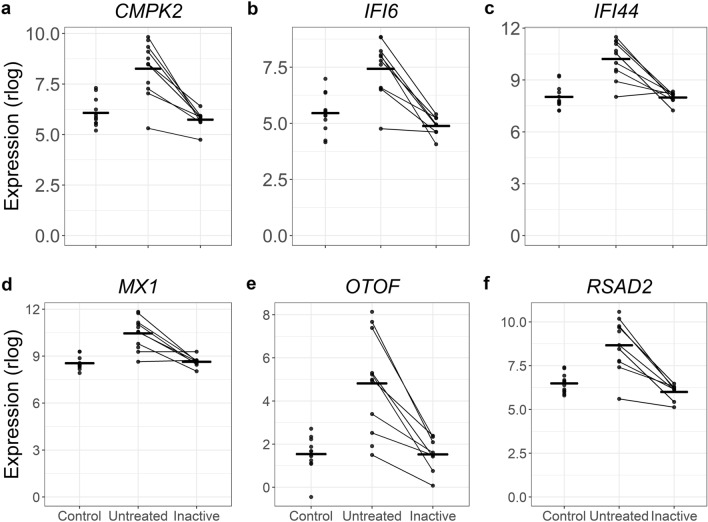
Figure 4.
A subset of genes increased in untreated JDM resolve when patients are clinically inactive. In each panel the layout is the same. The x-axis shows the status for each sample. The y-axis is the normalized expression (regularized logarithm method) from the RNA-Seq data. Each point is an individual sample. The lines connecting dots indicate sample pairings from the same individual. The horizontal bars are category means. For all these particular genes, the untreated sample PBMCs show substantially increased (and variable) increased expression. When inactive, the expression levels decreased toward the control expression level.

