Figure 2.
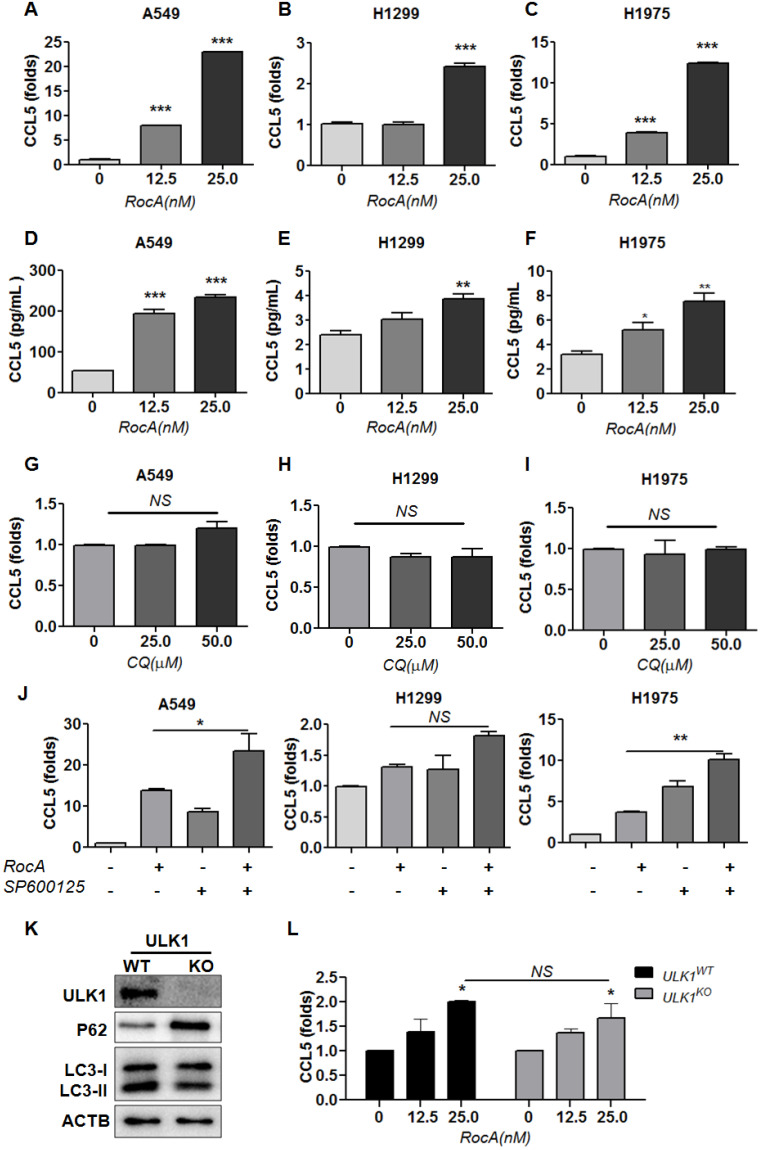
RocA increases the expression of CCL5 in NSCLC cells independent of autophagy inhibition. A549, H1299, and H1975 cells were exposed to different concentrations (0, 12.5, and 25 nM) of RocA for 24 h, and then the expression of CCL5 at the RNA (A-C) and protein (D-F) level was analyzed by real-time PCR and ELISA, respectively. G-I, A549, H1299, and H1975 cells were exposed to different concentrations (0, 25.0, and 50.0 µM) of CQ for 24 h, and then the expression of CCL5 was analyzed by real-time PCR. J, A549, H1299, and H1975 cells were treated with or without 25 nM RocA in the presence or absence of 10µM SP600125 for 24 h, and then the expression of CCL5 was analyzed by real-time PCR. Data were pooled from three independent experiments. K, The expressions of ULK1, p62, and LC3 in ULK1 wild-type (WT) and knockout (KO) H1299 cells were detected by Western blotting analysis. Data represented three independent experiments. L, ULK1WT, and ULK1KO H1299 cells were exposed to different concentrations (0, 12.5, and 25 nM) of RocA for 24 h, and then the expression of CCL5 was analyzed by real-time PCR. Data were pooled from three independent experiments. *, p < 0.05; **, p < 0.01; ***, p < 0.001; NS, non-statistical significance.

