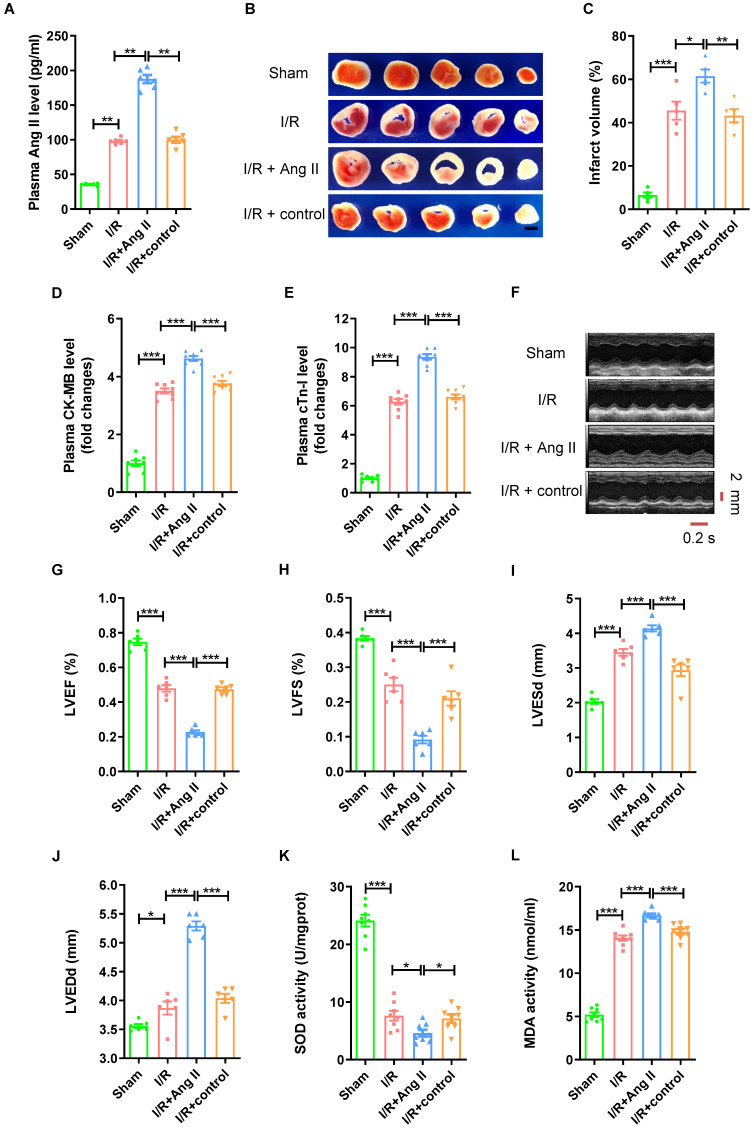
Figure 2.
Ang II perfusion aggravates myocardial I/R injury in mice. (A) Ang II levels in mouse plasma. (B-C) TTC staining and myocardial infarction volume, scale bar is 5 mm, n = 5. (D-E) CK-MB levels and cTn-I levels in mouse plasma. (F-J) Cardiac function indicators left ventricular ejection fraction (LVEF), left ventricular fraction (LVFS), left ventricular end systolic diameter (LVESd) and left ventricular end diastolic diameter (LVEDd) were assessed by echocardiography, time stamp is 0.2 s and scale bar is 2 mm. (K-L) The superoxide dismutase (SOD) activity and malondialdehyde (MDA) activity of myocardial tissue. The results are expressed as the mean±SEM, n = 8. * p < 0.05, ** p < 0.01, *** p < 0.001 by one-way ANOVA (Tukey's test).

