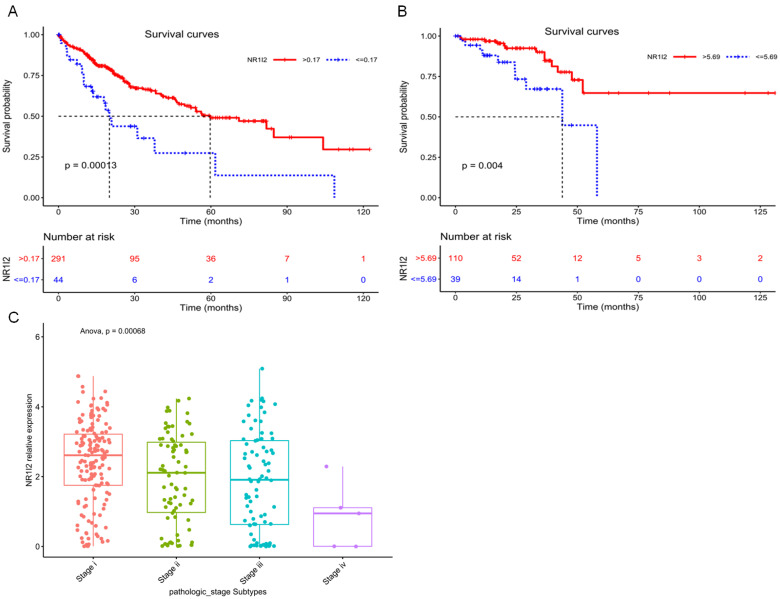
Figure 4.
Kaplan-Meier curves for survival analysis of Liver hepatocellular carcinoma (LIHC) patients and Rectum adenocarcinoma (READ) patients based on PXR (NR1I2) mRNA expression from TCGA database. A Survival analysis based on the best cutoff threshold (0.17) of PXR mRNA expression in LIHC patients (335 samples) (Red line: >0.17, blue line: < = 0.17). B Survival analysis based on the best cutoff threshold (5.69) of PXR mRNA expression in READ patients (149 samples) (Red line: >5.69, blue line: < = 5.69). C PXR mRNA expression in different pathologic stages of LIHC patients (Stage I 154 samples, Stage II 78 samples, Stage III 80 samples, Stage IV 5 samples) (Anova, p = 0.00068).

