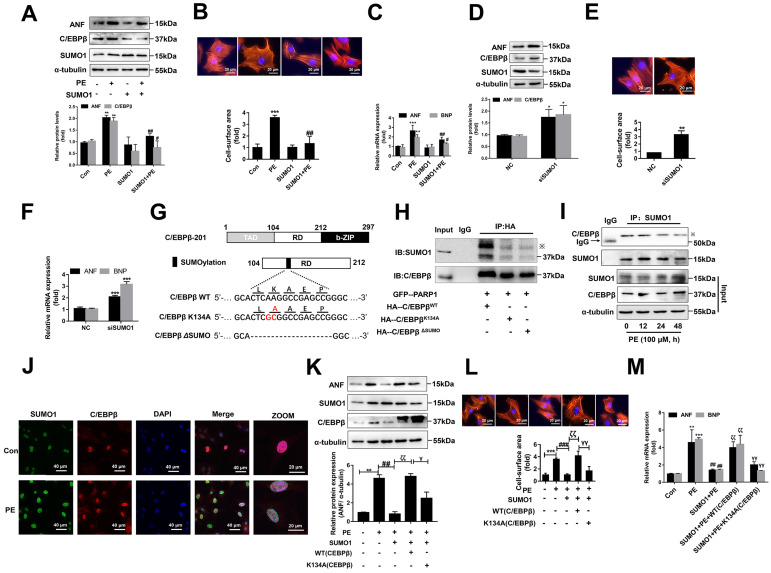
Figure 6.
SUMOylation of C/EBPβ at K134 site regulates C/EBPβ protein stability and prevents cardiac hypertrophy. (A) NRCMs were transfected with RFP-SUMO1 with or without PE treatment (100 μmol/L for 24 h), the protein levels of ANF and C/EBPβ were determined by western blot. **P < 0.01 vs. Con group, #P < 0.05, ##P < 0.01 vs. PE group, (n=3). (B) Cell surface area was measured by rhodamine staining. *P < 0.05 vs. Con group, ##P < 0.01 vs. PE group, (n=3). (C) The mRNA levels of ANF and BNP were determined by qRT-PCR. **P < 0.01, ***P < 0.001 vs. Con group, #P < 0.05, ##P < 0.01 vs. PE group, (n=3). (D) NRCMs were transfected with SUMO1 siRNA, the protein levels of C/EBPβ and ANF were determined by western blot. *P < 0.05 vs. NC group, (n=3). (E) Cell surface area was measured by rhodamine staining. **P < 0.01 vs. NC group, (n=3). (F) The mRNA levels of ANF and BNP were determined by qRT-PCR. ***P < 0.001 vs. Con group, (n=3). (G) The diagram of C/EBPβ protein domain, and the two mutant/truncated plasmids of C/EBPβ. (H) GFP-PARP1, HA-C/EBPβWT, HA-C/EBPβK134A and HA-C/EBPβΔSUMO were expressed in NRCMs, nuclear extracts were subjected to IP with anti-HA antibody followed by Western blot with anti-SUMO1, anti-C/EBPβ antibody. ※ indicates C/EBPβ-SUMO. n=3. (I) NRCMs were incubated with 100 μmol/L PE for the indicated durations, immunoprecipitated with anti-C/EBPβ antibody and subsequently subjected to Western blot analysis. n=3. (J) The intracellular co-localization of SUMO1 and C/EBPβ were confirmed in NRCMs, by confocal immunofluorescence microscopy with or without PE treatment (100 μmol/L for 24 h). n=3. (K) NRCMs were transfected with the expression vectors for RFP-SUMO1, HA-WT C/EBPβ and HA-K134A C/EBPβ as indicated followed by PE treatment (100 μmol/L for 24 h). The protein level of ANF was determined by western blot. **P < 0.01 vs. Con group, ##P < 0.01 vs. PE group, ζζP < 0.01 vs. PE+SUMO1 group, γP < 0.05 vs. PE+SUMO1+WT C/EBPβ group. (n=3). (L) Cell surface area was measured by rhodamine staining. ***P < 0.001 vs. Con group, ###P < 0.001 vs. PE group, ζζP < 0.01 vs. PE+SUMO1 group, γγP <0.01 vs. PE+SUMO1+WT C/EBPβ group. (n=3). (M) The mRNA levels of ANF and BNP were determined by qRT-PCR. *P < 0.05 vs. the Control group, **P < 0.01, ***P < 0.001 vs. Con group, ##P < 0.01 vs. PE group, ζζP < 0.01 vs. PE+SUMO1 group, γγP < 0.01 vs. PE+SUMO1+WT C/EBPβ group. (n=3).

