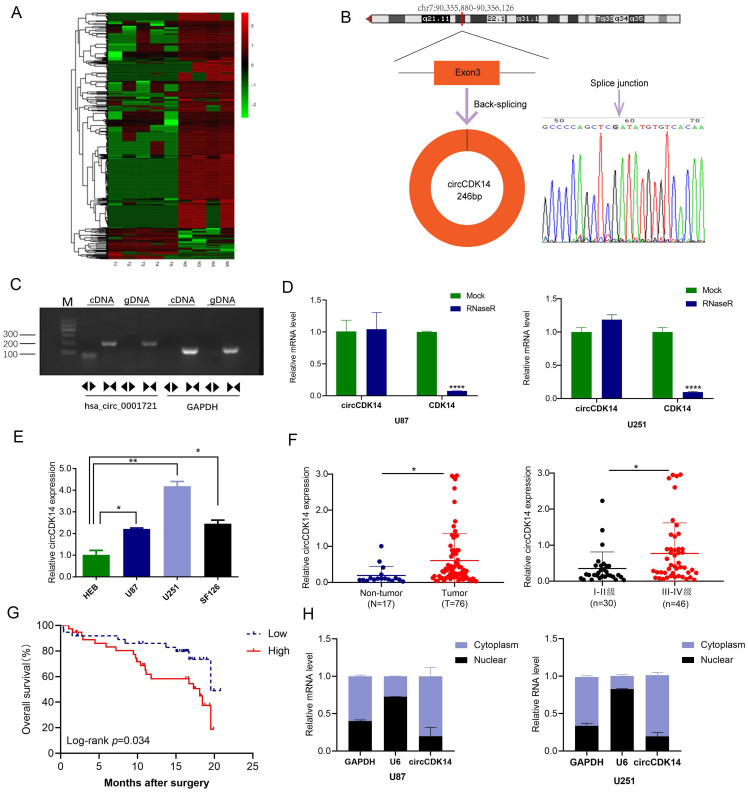
Figure 1.
Expression and characterization of circCDK14 in human glioma. (A) Clustered heatmap of significant differentially regulated circRNAs in glioma tissues and non-tumor brain tissues (|fold change >2, p<0.05). Red, up- and green, down-regulated. (B) Schematic illustration of genomic location and formation of circCDK14 (hsa_circ_0001721), derived from exons 3 circularization of CDK14 gene. The back-splice junction sequences of circCDK14 were confirmed by Sanger sequencing. Arrow, “head-to-tail” splice junction site. (C) PCR was analyzed to the circular RNA characterization of the circCDK14 (hsa_circ_0001721), using the divergent and convergent primers amplifying from the cDNA and gDNA of U251 cells, respectively. (D) qRT-PCR analysis of circCDK14 and linear CDK14 mRNA, in presence or absence of RNase R treatment for 30 min. (E) CircCDK14 levels, as quantified by qRT-PCR in human glioma cell lines (U87, U251 and SF126) and normal brain glial cells (HEB). circCDK14 expression level were significantly elevated in glioma cells, relative to HEB cells. (F) CircCDK14 levels in 76 glioma and 17 non-tumor brain tissues, and in 30 patients with I-II grade glioma and 46 patients with III-IV grade glioma. (G) Overall survival curve, based on circCDK14 levels, plotted with Kaplan-Meier methods and analyzed by rank test. (H) qRT-PCR analysis of circCDK14 expression location using nuclear and cytoplasmic fractions of U87 and U251 cells. U6 small nuclear RNA and GAPDH was endogenous control. Data expressed as mean±SD. *p< 0.05; **p< 0.01.

