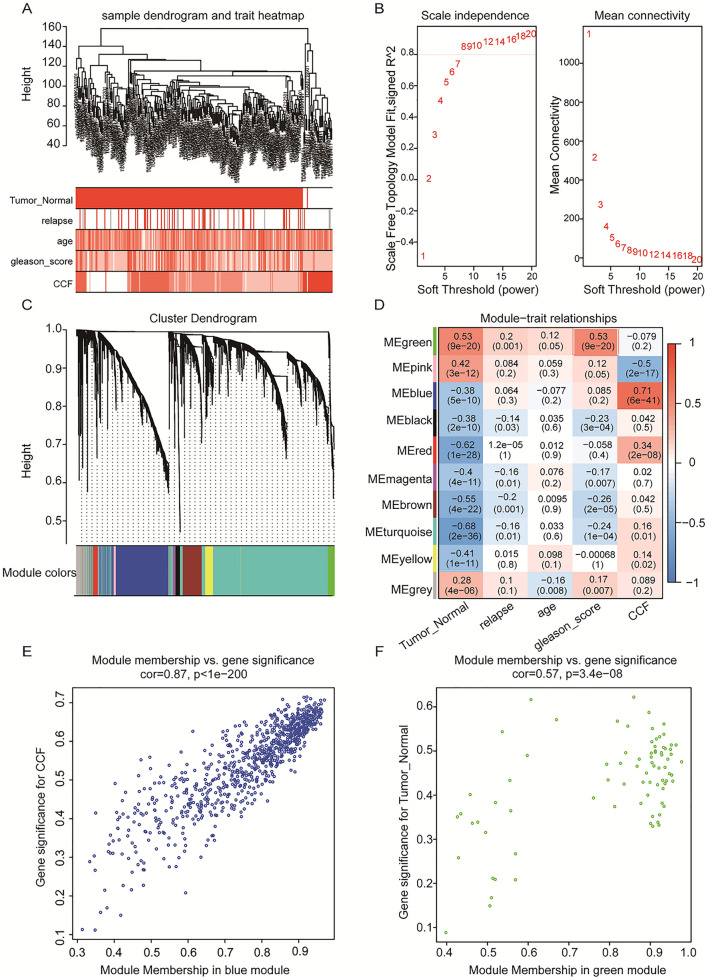
Figure 4.
Analysis of weighted gene co-expression networks for the construction of PCa. (A). Dendrogram combining clinical data and transcriptional expression profiles for sample Euclidean distance clustering. (B). Analysis of soft threshold power for WGCNA: (left) Analysis of the scale-free matching index (β) for various soft threshold powers. (Right) Analysis of the average connectivity of various soft threshold powers. (C). Dendrogram of all differentially expressed genes clustered based on the measure of variability (1-TOM). The colors bands show the results obtained from the automated individual cluster analysis. (D). The heat map shows the relationship between MEs and clinical characteristics. Each cell contains the corresponding correlation coefficient and p-value. (E, F). Scatterplot of gene significance versus module affiliation in the three selected key modules blue, green modules.

