Figure 6.
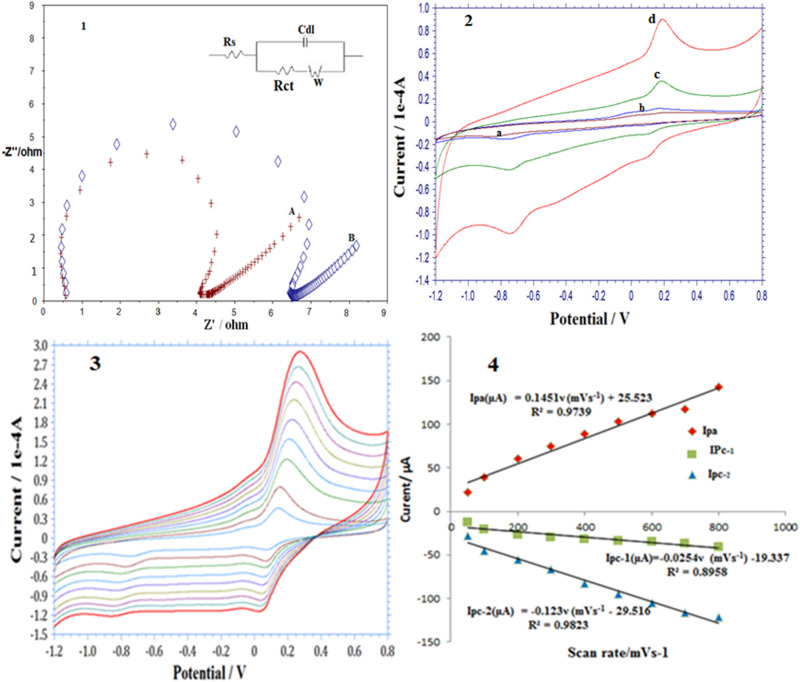
(1) Nyquist-plots for (A) GN:ZnO NC modified GCE and (B) GN modified GCE in 0.1 M KCl solution in presence of 1.0 mM each of Fe[(CN)6]−3 and Fe[(CN)6]−4 (1:1). Insert: Equivalent circuit for fitting the Nyquist-plot. (2) CV of (a) phosphate-buffer at pH 6.8 (blank) at bare GCE and 1.96 × 10⁻⁶ M p-NP in phosphate buffer at pH 6.8. (b) Bare GCE, (c) GN:GCE and (d) GN:ZnO NC modified GCE, Scan rate100 mVs−1. (A) Effect of scan-rate on peak current of p-NP (1.96 × 10⁻⁶ M) using cyclic voltammetry at 50, 100, 200, 300, 400, 500, 600, 700, 800 mVs−1 using GN:ZnO NC/GCE. (B) Plots of peak current (Ipa, Ipc) vs. potential scan rate (v).

