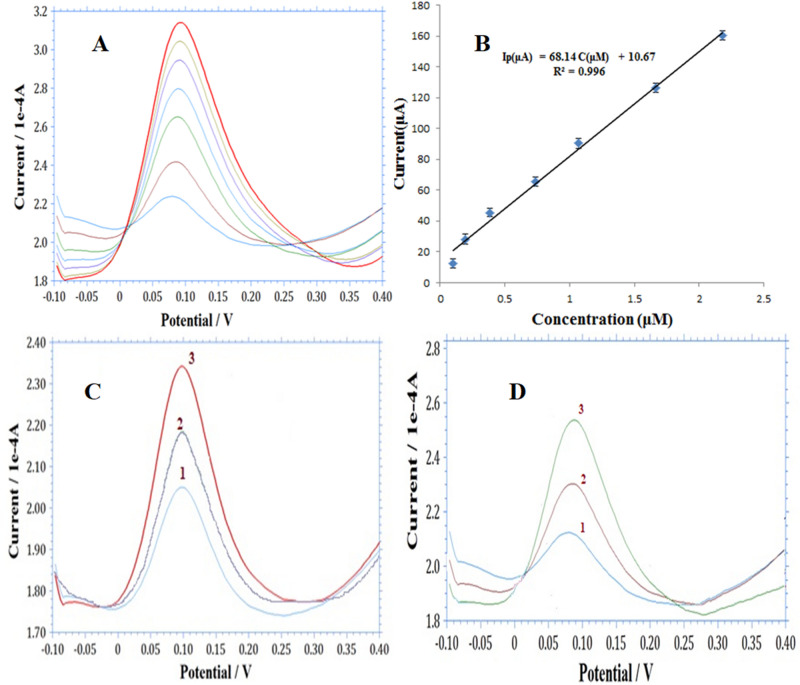
Figure 8.
(A) Square wave adsorptive stripping voltammograms at GN:ZnO NC/GCE at different concentrations of p-NP using phosphate buffer (pH 6.8). Deposition-potential: − 1.0 V, deposition-time: 300 s. (B) Plot of concentration of p-NP aganist peak current with error bars. (C) SW-AdS voltagrams for p-NP determination using standard adition method spiked with (1) 35.61 × 10⁻⁸ M ,(2) 71.22 × 10⁻⁸ M and 106.83 × 10⁻⁸ M p-NP in river water sample. (D) SW-AdS voltagrams for p-NP determination using standard adition method spiked with (1) 35.61 × 10⁻⁸ M , (2) 71.22 × 10⁻⁸ M and 106.83 × 10⁻⁸ M p-NP in ground water sample.

