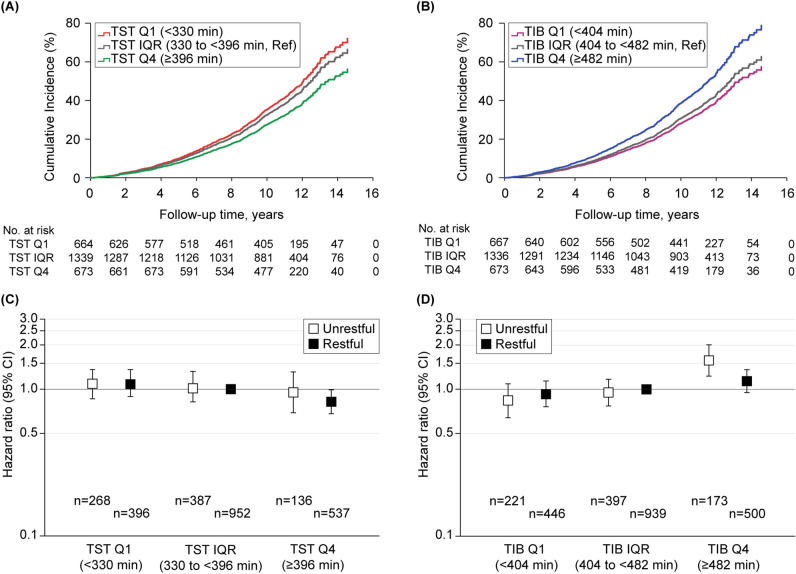
Figure 2.
Adjusted Cox regression plots by total sleep time, time in bed, and sleep restfulness for older adults. Differential cumulative incidences or hazard ratios from the fully adjusted Cox proportional hazard models (Model 3) are shown for older adults: (A) cumulative incidences by TST quartiles; (B) cumulative incidences by TIB quartiles; (C) hazard ratios by TST quartiles with sleep restfulness; and (D) hazard ratios by TIB quartiles with sleep restfulness. CI confidence interval, IQR interquartile range, Q1 lowest quartile, Q4 highest quartile, Ref reference, TIB time in bed, TST total sleep time.

