
Figure 2.
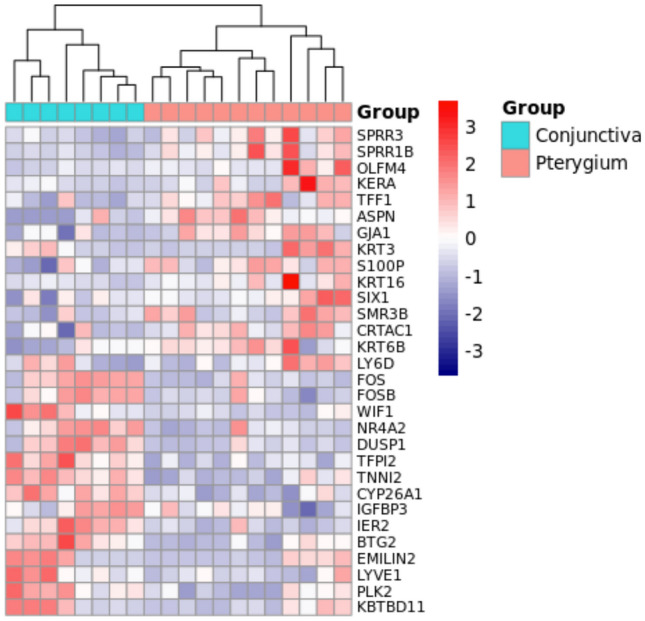
Gene expression pattern of conjunctiva and pterygium from the meta-analysis. The heatmap was constructed using the top 30 differentially expressed genes (15 up- and 15 down-regulated). The dendrogram indicates two clusters stratified using hierarchical clustering. Expression pattern was rescaled using a list of human housekeeping genes from HRT Atlas database44. High expression is indicated in red and low expression is indicated in blue.