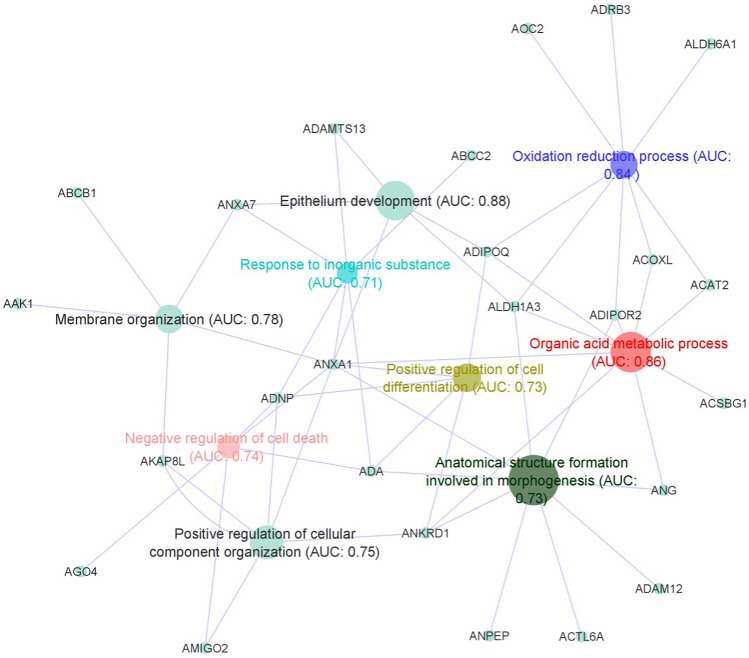
Figure 5.
Functional analysis of the down-regulated genes identified in the meta-analysis based on FAIME algorithm. Main down-regulated pathways are indicated by colored nodes. Pathways were selected based on the FAIME scores computed using the expression of down-regulated genes (grey dots). AUC was used to evaluate the discriminatory capacity of each enriched term for a binary classification (pterygium vs. control). FAIME: Functional Analysis of Individual Microarray/RNAseq Expression; AUC: Area Under the curve.

