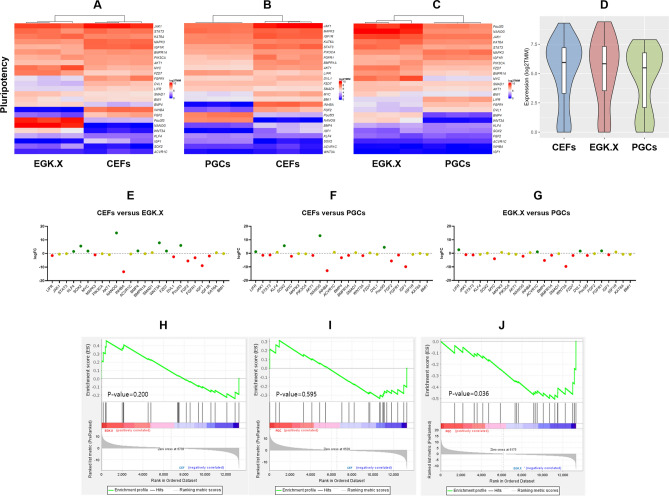
Figure 5.
Expression profiling of pluripotency regulating genes. (A–C) Heatmaps using log2 TMM values of the normalized read counts of pluripotency regulating genes in CEFs and EGK.X blastoderms (A), CEFs and PGCs (B), and EGK.X blastoderms and PGCs (C) were prepared separately for better visualization. (D) Violin plots were prepared with the log2 TMM values to visualize the overall expression of pluripotency regulating genes in CEFs, EGK.X blastoderms, and PGCs. (E–G) DEGs of pluripotency regulating pathway between the test samples. DEGs in EGK.X blastoderms compared with CEFs, DEGs in PGCs compared with CEFs, and DEGs in PGCs compared with EGK.X blastoderms were shown in (E–G), respectively. Green: significantly upregulated. Red: significantly downregulated. Yellow: unregulated. (H–J) GSEA of pluripotency regulating genes at CEFs versus EGK.X blastoderms (H), CEFs versus PGCs (I), and EGK.X blastoderms versus PGCs (J) conditions.

