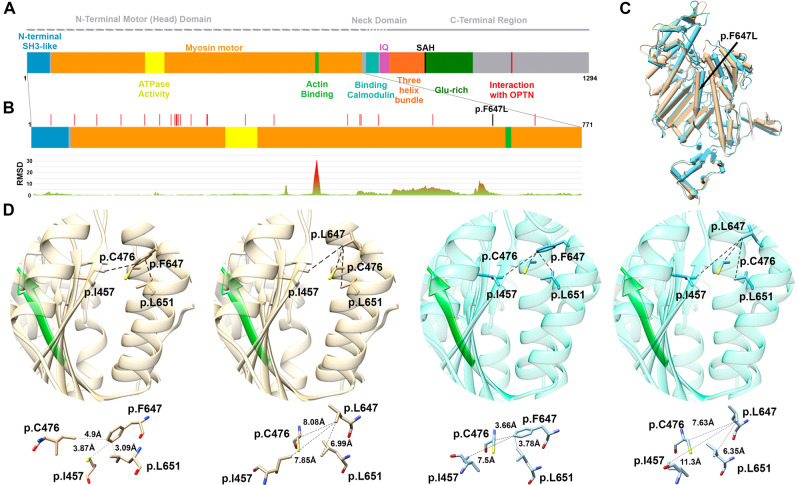
Figure 3.
Motor head domain analysis of MYO6 protein. (A) Ideogram of MYO6. (B) RSMD analysis of the motor head domain shows peaks with high RMSD values, revealing that two areas (one including the p.(F647L)) are involved in regions with great motility between pre-powerstroke and Pi release conformations. (C) Motor head domain modeling. Pre-powerstroke conformation in light blue and Pi release in brown. The p.(Phe647Leu) is shown with a black arrow. (D) Zoom in of the alpha-helix at the 647 region. The interaction of the wild-type Phe647 residue or the mutated version Leu647 with the three nearest residues is shown for each protein conformation (Pi release in brown and pre-powerstroke in light blue). The β-strand in green represents the actin binding region. Distances in Å are detailed under each bubble, showing the increase in the distances for the mutated Leu647 residue in both conformations.

