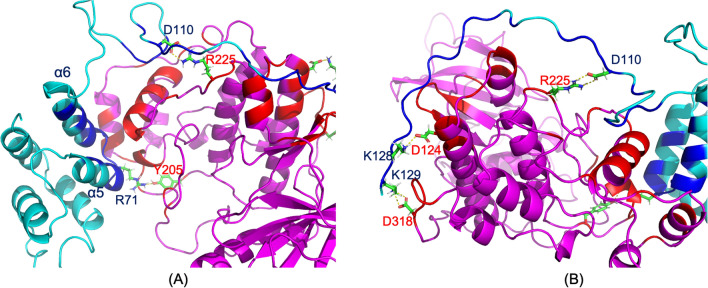
Figure 3.
Binding interfaces in the simulated PEA-15/ERK2 complex. PEA-15 is shown in cyan and ERK2 in magenta. Interface residues on PEA-15 are colored in dark blue, and residues on ERK2 are colored in red. (A) The interface between PEA-15 DED and ERK2 DEF docking site. PEA-15 interacts with ERK2 with its helices α5/α6, including direct interaction between PEA-15 R71 and ERK2 Y205, consistent with crystal structure 4IZ5. (B) Interface between PEA-15 C-terminal tail and ERK2 D-peptide binding site, including interactions between PEA-15 K128 and ERK2 D124 and PEA-15 K129 and ERK2 D318. Another interaction that can be observed is between PEA-15 D110 and ERK2 R225. There are no direct interactions between either phosphorylation sites, S104 and S116, and ERK2 residues. The molecular structures were visualized and generated using PyMOL version 2.4 (http://www.pymol.org/).

