Figure 6.
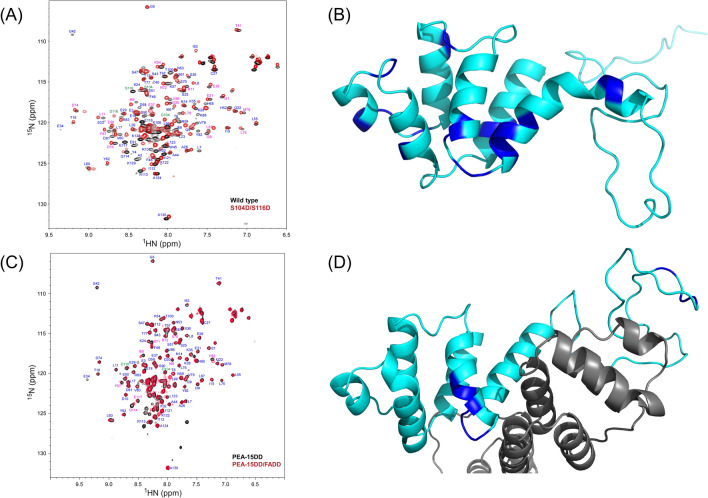
(A) Partial assignment of 2D HSQC 1H–15N correlation spectrum of PEA-15DD double mutant (red) overlaid with wild-type PEA-15 (black) spectrum. The assigned resonances are labeled next to the corresponding peaks. The resonances for wild-type S104 and S116 and the mutants S104D and S116D are labeled in green, the resonances experiencing significant chemical shift perturbation (CSP) upon mutation are labeled in magenta, and other resonances not shifted by mutation are labeled in blue. (B) Residues that experience significant CSP upon double mutation/double phosphorylation are mapped on the simulated PEA-15pp structure (cyan) and colored in blue. These residues include residues from helices α3, α5, and α6, as well as residues after the kink at the end of helix α6. (C) Partial assignment of 2D HSQC 1H–15N correlation spectra of PEA-15DD in its free form (black) and FADD-bound form (red). The available assignment for each resonance is labeled next to the peak. The two mutation sites, S104D and S116D, are labeled in green, the resonances experiencing significant CSP upon FADD binding are labeled in magenta, and other resonances not shifted by FADD binding are labeled in blue. (D) Residues that experience significant CSP on PEA-15DD (cyan) upon FADD binding are mapped on the simulated PEA-15pp/FADD structure and colored in blue. These residues are mostly from α5/α6 surface engaging in FADD binding. FADD is colored in grey. The NMR spectra in (A) and (C) were plotted using NMRViewJ version 9.2 (https://nmrfx.org/nmrfx/nmrviewj), and the molecular structures in (B) and (D) were visualized and generated using PyMOL version 2.4 (http://www.pymol.org/).

