Figure 8.
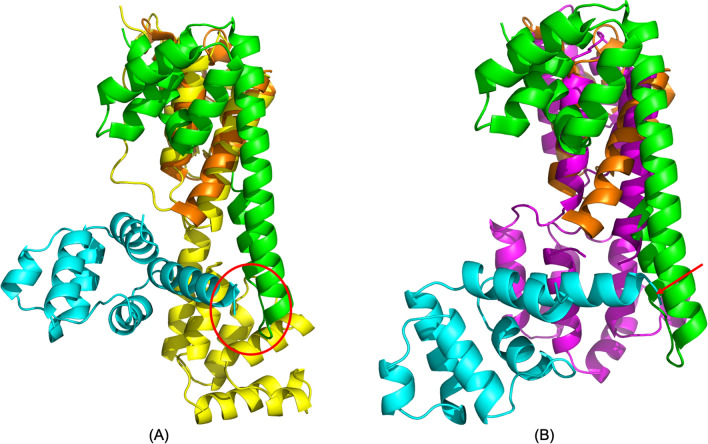
(A) Overlay of simulated PEA-15pp/FADD complex (PEA-15pp in cyan and FADD in yellow) onto Fas–FADD DD complex crystal structure (Fas DD in green and FADD DD in orange), 3EQZ, over FADD DD residues. The simulated FADD DD structure matches very well with the crystal structure with the RMSD of 1.610 Å. (B) Overlay of NMR structure of intact FADD (magenta), 2GF5, onto Fas–FDD DD complex crystal structure (Fas DD in green and FADD DD in orange), 3EQZ over FADD DD residues. The RMSD between FADD DD is 4.334 Å, indicating a conformational change in the DD upon complex formation. Assuming PEA-15pp binds to the same position of FADD DED (shown in cyan), its helix α6 will clash with the newly formed stem helix and C-helix on Fas DD (indicated by red arrow). In our simulated structure, however, due to the relative repositioning of FADD DD and DED, the bound PEA-15 DED can avoid such steric hindrance, indicated as the red circle in (A). The C-terminal tail of PEA-15pp is not shown for clarity. The molecular structures were visualized and generated using PyMOL version 2.4 (http://www.pymol.org/).

