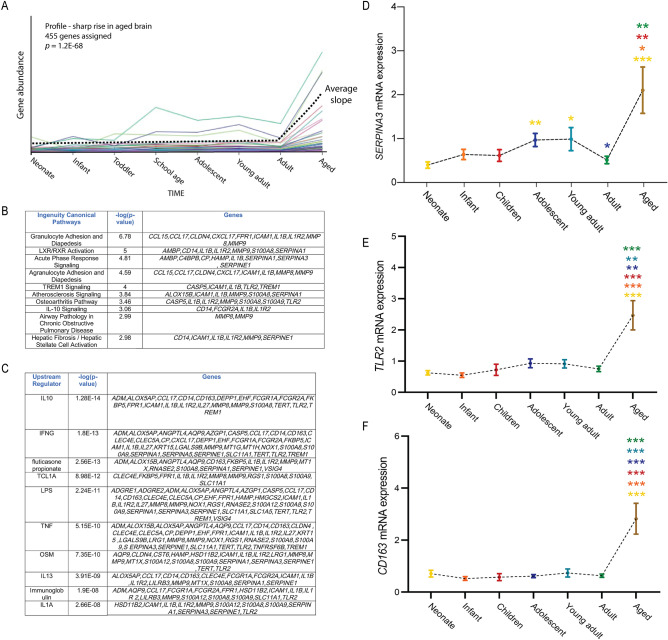
Figure 5.
Transcripts that showed a sharp increase in expression within the aged SEZ. (A) The third major profile that we identified related to genes whose expression was relatively steady within the SEZ throughout life, until increasing sharply within the aged brain. There were 455 genes associated with this profile. Ingenuity analysis revealed many immune-associated pathways associated with this profile (B), as well as many immune-associated upstream regulators potentially linked to it (C). (D–F) The expression of SERPINA3 (D), TLR2 (E) and CD163 (F) as measured by qPCR was consistent with our sequencing data, with the expression of these genes being significantly higher in the aged brain when compared to other age groups. Colours for significance (***) correspond to the colour of the age group used in the comparison. *p < 0.05, **p < 0.01, ***p < 0.001; Kruskal–Wallis H test or analysis of covariance, post hoc tests with Bonferroni or LSD.

