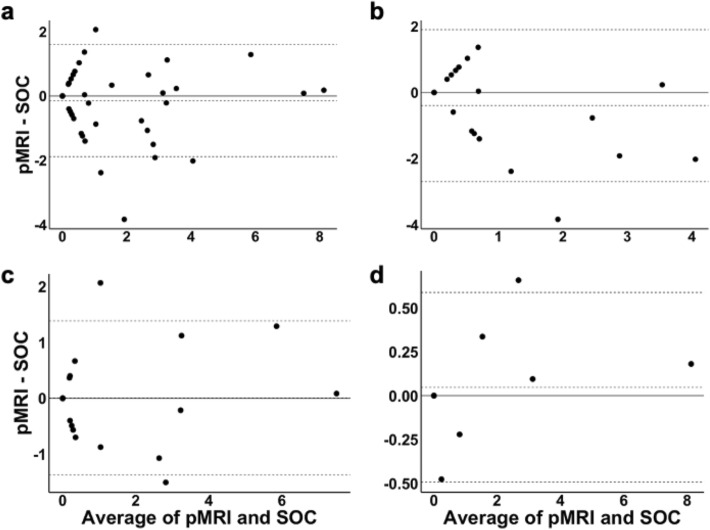
Figure 3.
Bland–Altman plots of averaged portable MRI (pMRI) and standard-of-care (SOC) midline shift (MLS) assessments. (a) The Bland–Altman plot of pMRI and SOC MLS assessments for all patients demonstrated a bias of − 0.14 mm and limits of agreement from 1.60 mm to − 1.89 mm. Four measures (6%) were outside the limits of agreement. (b) The Bland–Altman plot of pMRI and SOC MLS assessments for patients scanned using pMRI software versions RC3 and RC4 showed a bias of − 0.40 mm and limits of agreement from 1.90 mm to − 2.70 mm. One measure (4%) was outside the limits of agreement. (c) The Bland–Altman plot of pMRI and SOC MLS assessments for patients scanned using pMRI software versions RC5 and RC6 showed a bias of 0.01 mm and limits of agreement from 1.39 mm to − 1.37 mm. Two measures (7%) were outside the limits of agreement. (d) The Bland–Altman plot of pMRI and SOC MLS assessments for patients scanned using pMRI software versions RC7 and RC8 demonstrated a bias of 0.05 mm and limits of agreement from 0.59 mm to − 0.49 mm. One measure (8%) was outside the limits of agreement. Figure created using: (1) RStudio Team (2019). RStudio: Integrated Development for R. RStudio, Inc., Boston, MA URL http://www.rstudio.com/, (2) Microsoft PowerPoint, Version 16.52, https://www.microsoft.com/en-us/microsoft-365/powerpoint.

