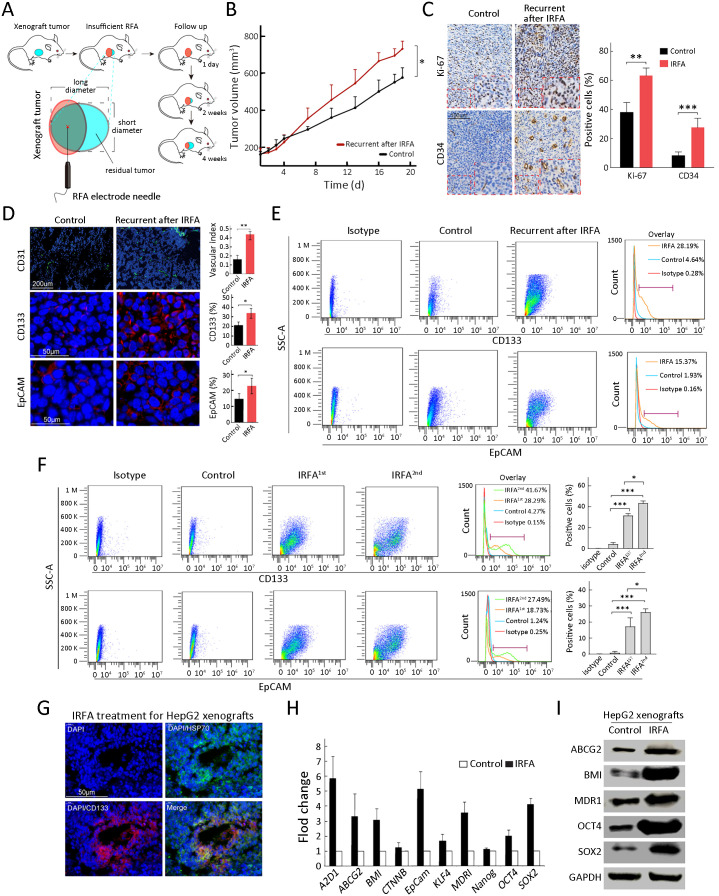
Figure 3.
Enrichment of TICs after IRFA treatment in vivo. (A) A schematic diagram for IRFA treatment in mice xenografts. Orange area: IRFA zone; (B) Tumor growth of HepG2 xenografts in NOD/SCID mice treated with/without IRFA (n=6/group) (P<0.05); (C) Expressions of Ki-67 and CD34 in xenograft tumors were detected by immunohistochemistry assay; (D) Vascular index and percentage of CD133+, CD31+ and EpCAM+ in HepG2 xenografts in NOD/SCID mice were detected by immunofluorescence staining. Nuclei were stained with DAPI (blue); (E,F) CD133+ and EpCAM+ subpopulation of HepG2 xenografts were analyzed by FCA; (G) HSP70+ and CD133+ cells at the fringe of post-RFA necrosis lesions after 48 h treatment; (H,I) Expression levels of stem cell-related genes in xenografts are analyzed by qRT-PCR (H) and Western blot (I). Bar graphs (in C,D,F,H) are presented as
 . TIC, tumor-initiating cell; IRFA, insufficient radiofrequency ablation; RFA, radiofrequency ablation; EpCAM, epithelial cell adhesion molecule; FCA, flow cytometric analysis; SSC-A, side scatter area; HSP, heat shock protein; qRT-PCR, quantitative real-time polymerase chain reaction. *, P<0.05;**, P<0.01;***, P<0.001.

