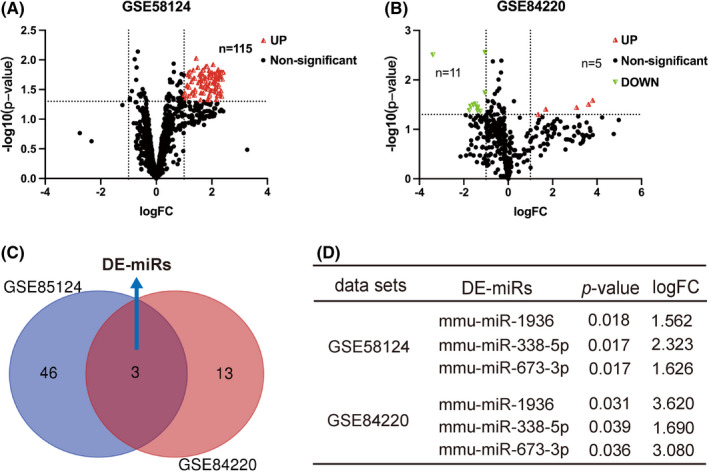
FIGURE 3.

Volcano plots and Venn diagram of this study. (A, B) Volcano plots of the distribution of all differentially expressed miRNAs that were selected with a p value < 0.05 and |Log (Fold Change) | >1. Upregulated, downregulated and not significantly changed miRNAs are marked, respectively, as red, green and black dots. From the retina tissues in the data set, a total of 115 miRNAs were differentially expressed in the GSE58124 data sets, and all were upregulated. Sixteen differentially expressed miRNAs (5 upregulated and 11 downregulated) were screened out from the GSE84220 data sets. (C) Venn diagram of co‐expressed miRNAs within GSE58124 and GSE84220, with consensus defined as DE‐miRs. (D) mmu‐miR‐1936, mmu‐miR‐338‐5p and mmu‐miR‐673‐3p were screened out as DE‐miRs; their specific p and logFC values are listed in the two data sets
