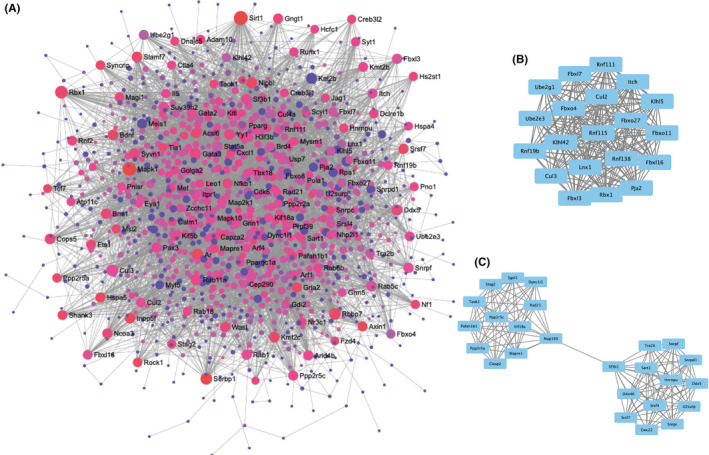
FIGURE 5.

Protein network analysis of 1340 unique target genes. (A) Protein‐protein‐interaction (PPI) network constructed using STRING database and visualized by NetworkAnalyst. The degree of connectivity is shown by the size of the node, with larger circles indicating greater connectivity. The colour of the node represents the value of the betweenness from red (large) to purple (small). (B, C) Top two clusters of functional modules as determined by using the Molecular Complex Detection (MCODE) plug‐in of Cytoscape (version 3.8.0)
