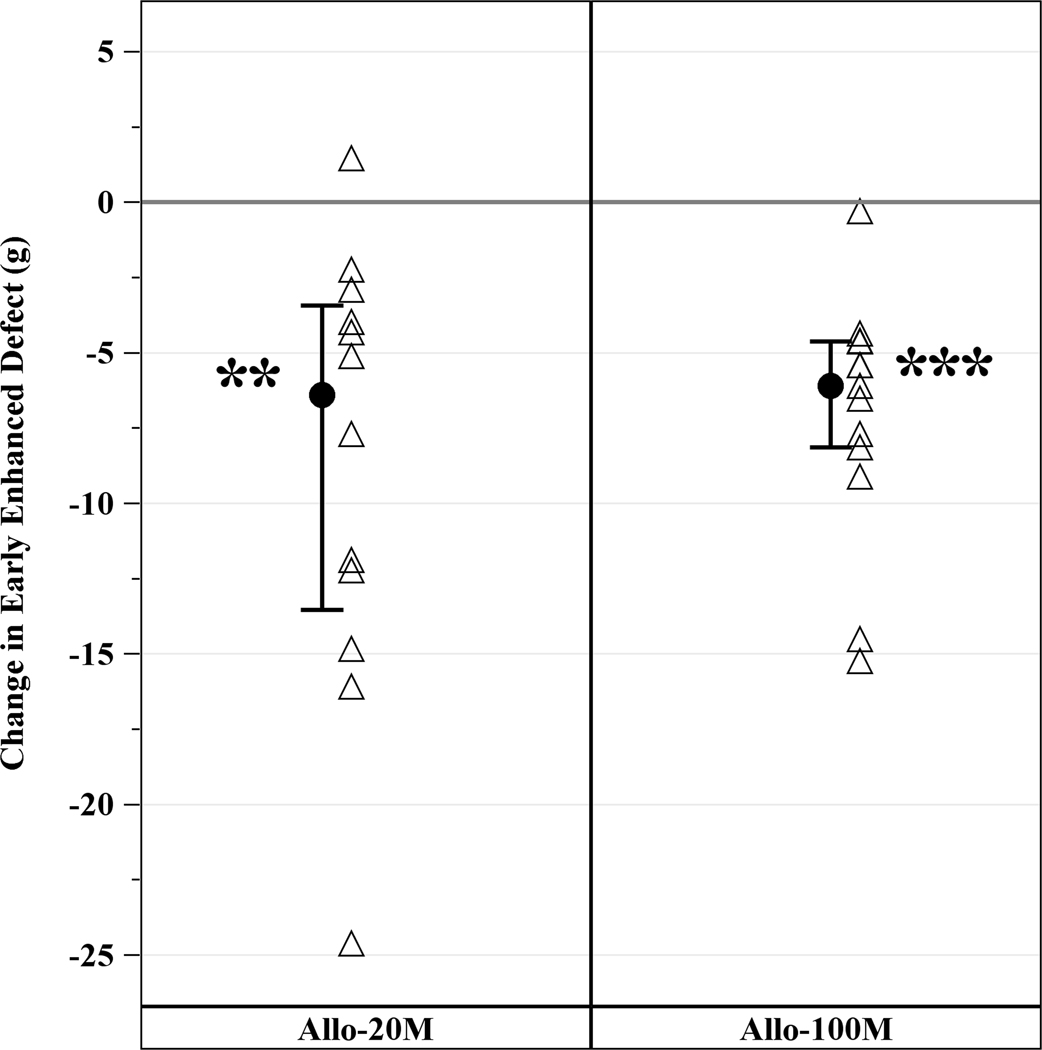
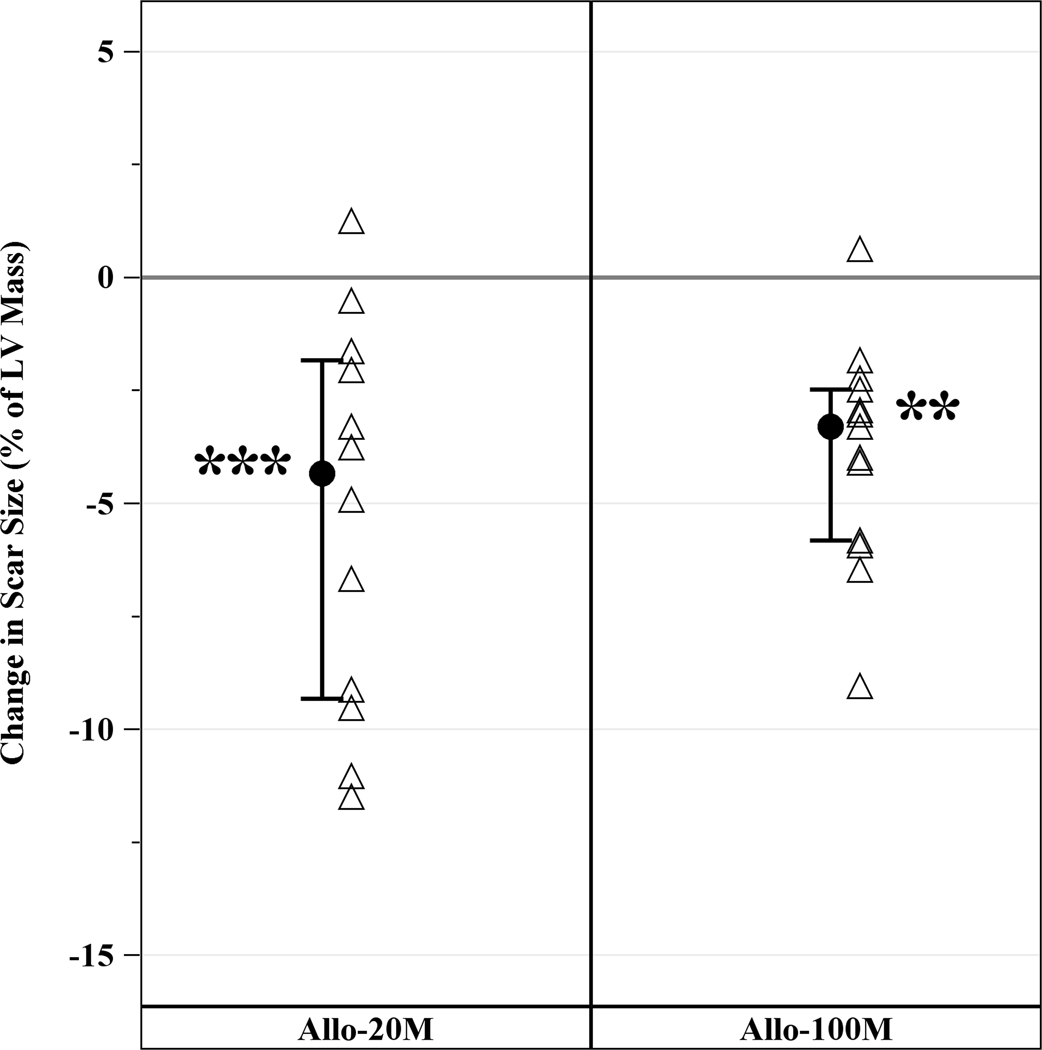
Figure 3. Changes in Scar Size from Baseline to 12 months post-TESI.
Both group reduced scar size and scar size as a fraction of LV mass by similar degree. (A) Scar size reduction in 20M by −6.4g (IQR, 13.5g, −3.4g, p=0.001) and 100M by −6.1g (IQR, −8.1g, −4.6g, p=0.0002), between groups (p=0.91). (B) Scar size as a percentage of LV mass decreased in 20M by 3.30% (−5.82%, −2.48%, p=0.0005) and 100M by 4.34% (−9.32%, −1.84%, p=0.0015), between groups (p=0.6). **Within-group p≤0.005, ***within-group p≤0.0005.


