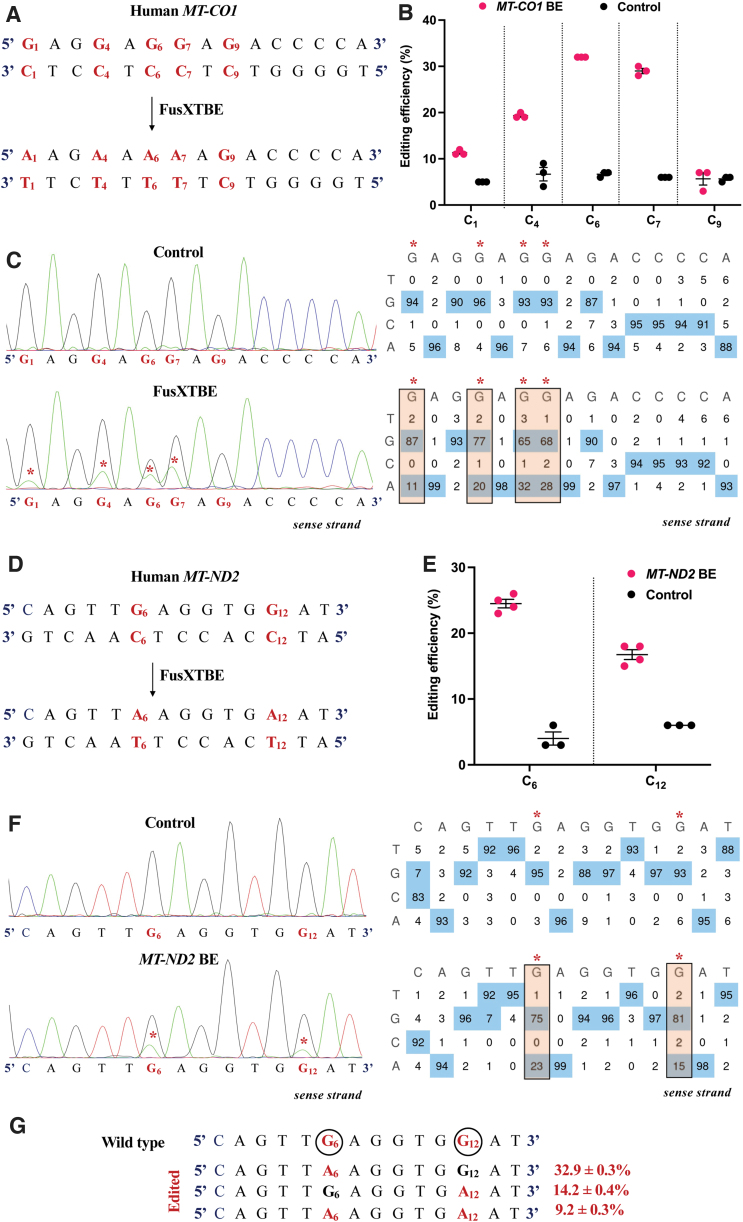
FIG. 4.
Engineering base edits in MT-CO1 and MT-ND2 genes in vitro using the FusXTBE system. (A) Sequence of the potential editing sites in the MT-CO1 protospacer region. (B) Editing efficiency for the 5′TCs present in the protospacer region plotted as individual data points for each of the target nucleotides in the transfected and control HEK293T cells. Error bars are represented as standard error of the mean. (C) Representative chromatogram of the control and cells transfected with MT-CO1 FusXTBE plasmid. Asterisk (*) denotes the site of edit with corresponding editing percentage (C-to-T or G-to-A). (D) Protospacer region in the MT-ND2 locus highlighting the edited nucleotides. (E) Editing efficiency assessed by Sanger sequencing of mitochondrial FusXTBE for the each of the 5′TCs (C6 and C12) in the MT-ND2 target locus. Error bars are represented as standard error of the mean. (F) Representative chromatogram of the control (nontransfected) and cells transfected with MT-ND2 FusXTBE plasmid DNA. Asterisk (*) denotes the sites of edit (C6 and C12 positions). (G) Editing frequency of MT-ND2 alleles obtained by deep sequencing. Edited cytosine (antisense strand) residue (or guanine on the sense strand) is highlighted in red and circled. Frequency reflects the mean percentage ± standard deviation from independent biological replicates [N = 3 for MT-CO1, N = 4 for MT-ND2 (C6), and N = 3 for MT-ND2 (C12)]. Each point represents data from independent experiments. Chromatograms and editing table plot were obtained using EditR. The combination of left arm- pKTol2C-FusXTBE-C and right arm- pKTol2C-FusXTBE-N was used to obtain the edits. Color images are available online.

