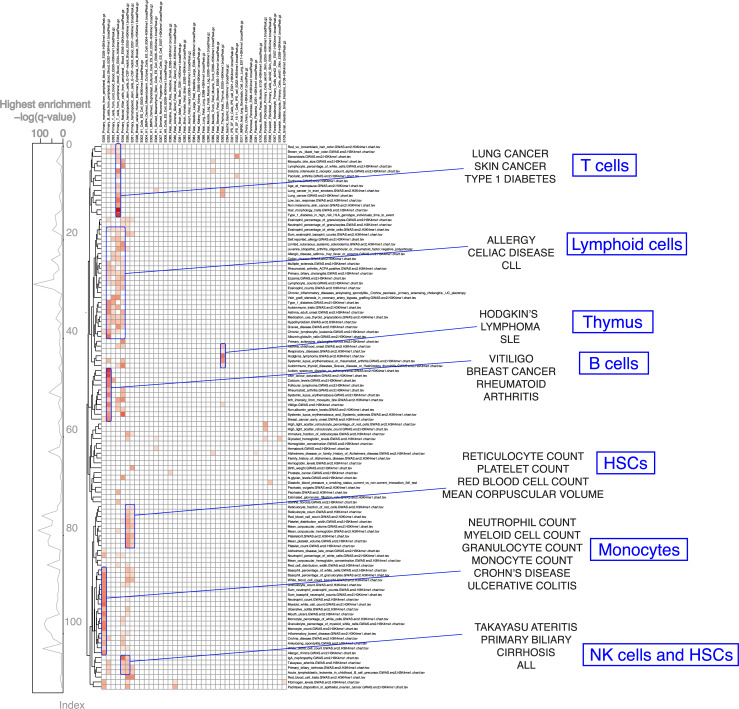
Fig. 2.
GWAS enrichments for immune cell H3K4me1 broadPeaks from consolidated Roadmap Epigenomics consortium data: shown are significant cell type-specific enrichment results (q value < 0.01, BH correction) for FORGE2 analysis across the NHGRI/EBI GWAS catalogue (downloaded 2 September 2019). GWAS phenotypes (rows) are clustered using complete linkage clustering (Euclidean distance), while different tissues and cell types (columns) are grouped according to related tissue or cell type categories (e.g. T cell categories are placed together, as are haematopoietic stem cell categories, etc.). All sample categories, including non-immune cell categories, are shown. Values are row-normalised, with reference lineplot on the left indicating top enrichment value for each category. Clustering reveals grouping of related phenotypes with similar immune cell type-specific enrichment profiles. We highlighted several groups including known related phenotypes such as mean corpuscular volume for HSCs, monocyte count for monocytes and rheumatoid arthritis for B cells (right panel). A zoomable version of this figure can be found at: https://www.easyzoom.com/imageaccess/e8c2fd02c90f456b85f629635c2f30a3

